• Acta Optica Sinica
  • Vol. 40, Issue 24, 2430001 (2020)
Minghui Zhang1、2, Lien Hu1、2, Dan Yao1、2, Yue Yang1、2, Chuantao Zheng1、2、*, and Yiding Wang1、2
Author Affiliations
  • 1State Key Laboratory of Integrated Optoelectronics, College of Electronic Science and Engineering, Jilin University, Changchun, Jilin 130012, China
  • 2Jilin Provincial Engineering Research Center of Infrared Gas Sensing Technique, Changchun, Jilin 130012, China
  • show less
    DOI: 10.3788/AOS202040.2430001 Cite this Article Set citation alerts
    Minghui Zhang, Lien Hu, Dan Yao, Yue Yang, Chuantao Zheng, Yiding Wang. Quartz Tuning Fork Enhanced Photoacoustic Spectroscopic Methane Detection System[J]. Acta Optica Sinica, 2020, 40(24): 2430001 Copy Citation Text show less
    Quartz enhanced spectrophone with different structures. (a) On-beam structure; (b) off-beam structure
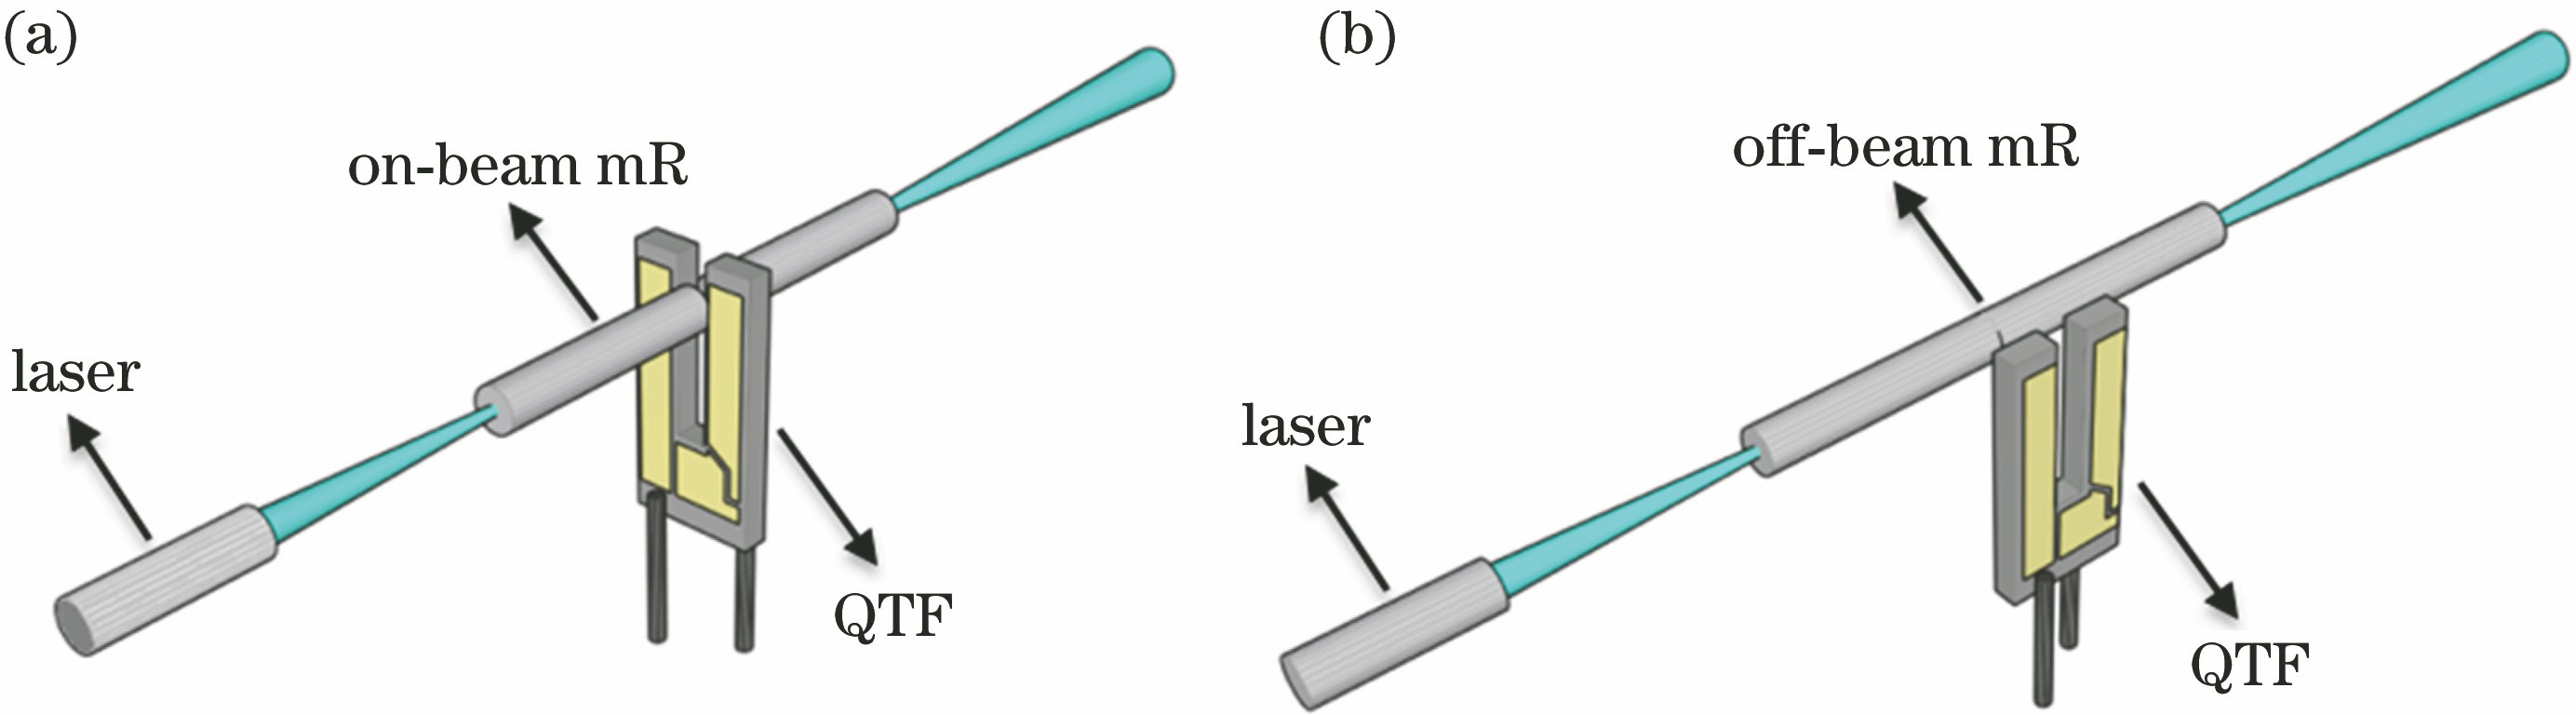
    Fig. 1. Quartz enhanced spectrophone with different structures. (a) On-beam structure; (b) off-beam structure
    Absorption spectra of CH4 and H2O at standard atmospheric pressure and 1 cm optical path length. (a) Absorption spectra of CH4 (volume fraction of 5×10⁻⁴) in the range of 1620-1680 nm; (b) absorption spectra of H2O (volume fraction of 1%) and CH4 (volume fraction of 5×10⁻⁴) in the range of 1653-1654 nm
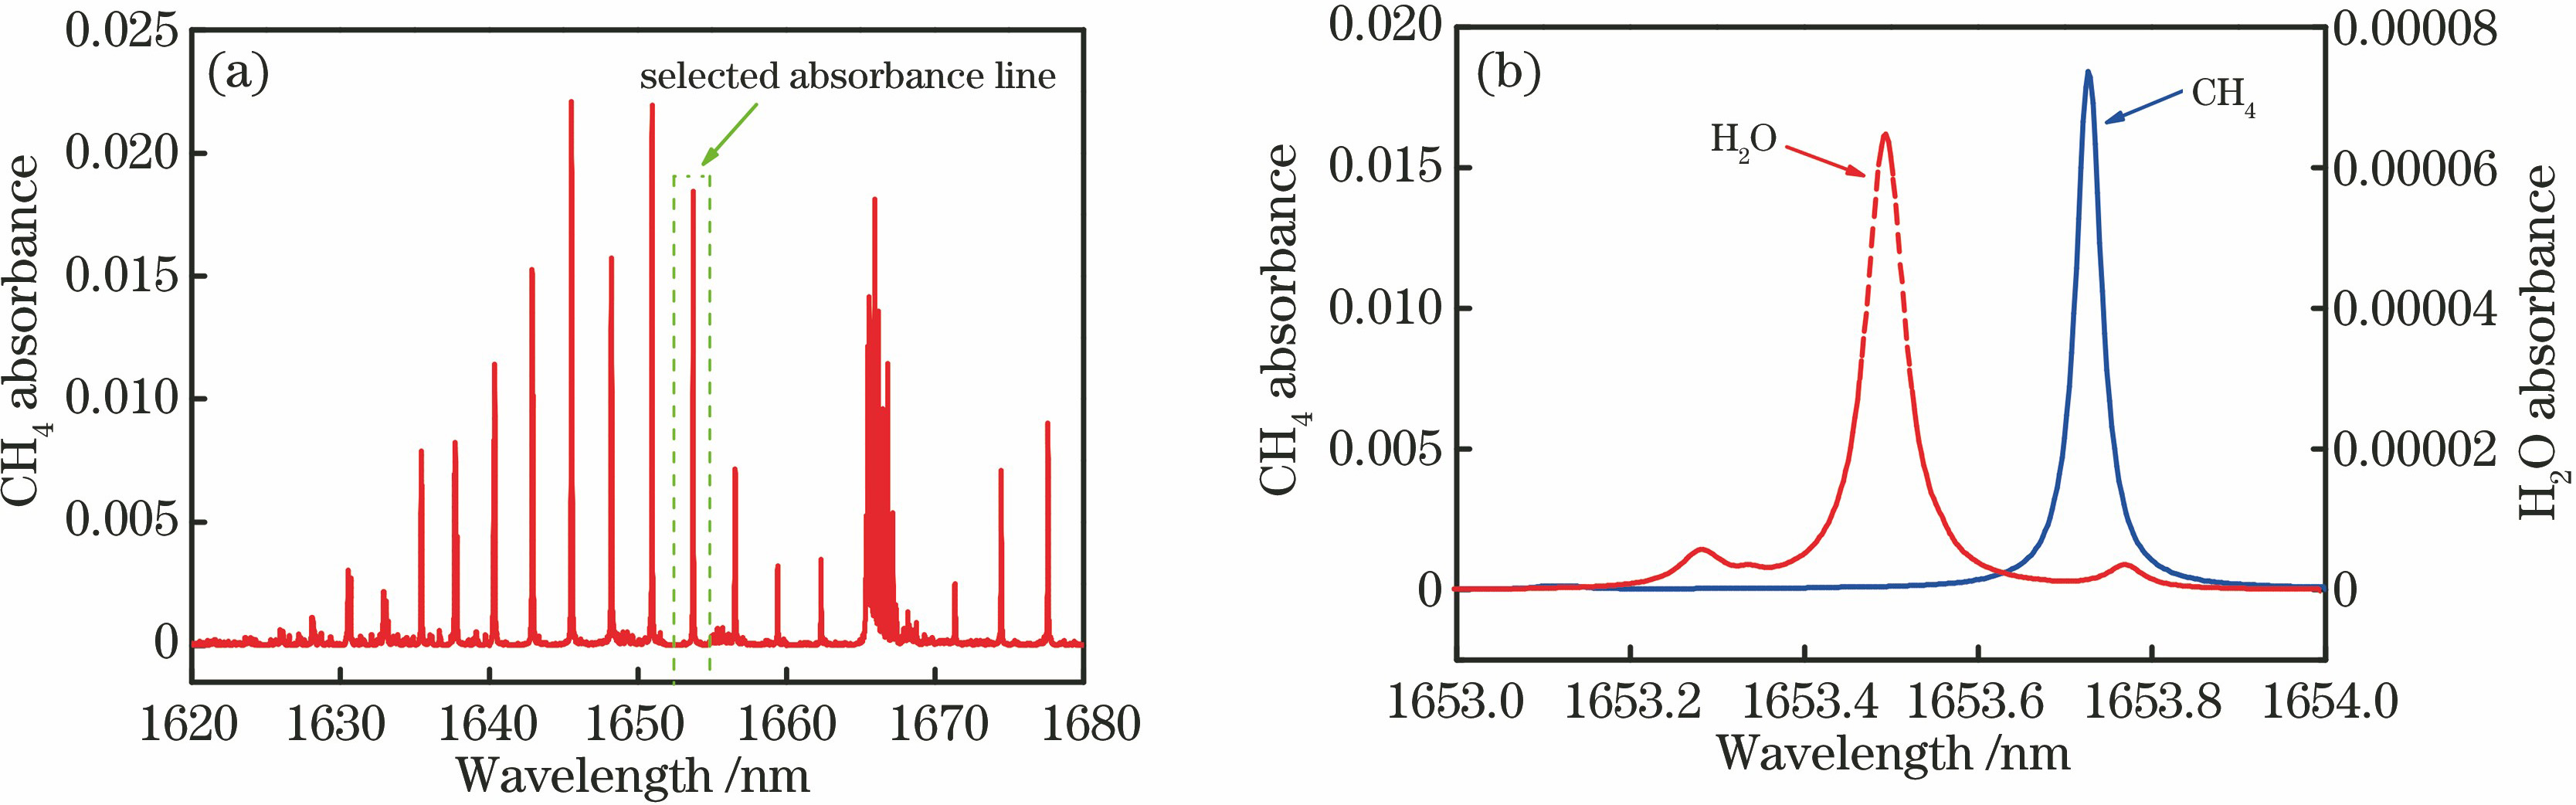
    Fig. 2. Absorption spectra of CH4 and H2O at standard atmospheric pressure and 1 cm optical path length. (a) Absorption spectra of CH4 (volume fraction of 5×10⁻⁴) in the range of 1620-1680 nm; (b) absorption spectra of H2O (volume fraction of 1%) and CH4 (volume fraction of 5×10⁻⁴) in the range of 1653-1654 nm
    CH4 detection system and miniature gas chamber. (a) Diagram of CH4 detection system; (b) miniature gas chamber; (c) mechanical design model of miniature gas chamber
    Fig. 3. CH4 detection system and miniature gas chamber. (a) Diagram of CH4 detection system; (b) miniature gas chamber; (c) mechanical design model of miniature gas chamber
    Variation of normalized 2f signal amplitude and modulation depth with modulation voltage signal amplitude
    Fig. 4. Variation of normalized 2f signal amplitude and modulation depth with modulation voltage signal amplitude
    Measured 2f signal waveforms at different CH4 concentration levels
    Fig. 5. Measured 2f signal waveforms at different CH4 concentration levels
    Measured 2f signal amplitude under different CH4 concentration levels and relationship curve between CH4 concentration and averaged 2f signal amplitude. (a) 2f signal amplitude; (b) relationship curve between CH4 concentration and averaged 2f signal amplitude
    Fig. 6. Measured 2f signal amplitude under different CH4 concentration levels and relationship curve between CH4 concentration and averaged 2f signal amplitude. (a) 2f signal amplitude; (b) relationship curve between CH4 concentration and averaged 2f signal amplitude
    Measurement system noise in N2 environment
    Fig. 7. Measurement system noise in N2 environment
    Variation curve of CH4 concentration measured in N2 environment with average time and variation curve of Allan variance with average time. (a) Variation curve of CH4 concentration with average time; (b) Allan variance with average time
    Fig. 8. Variation curve of CH4 concentration measured in N2 environment with average time and variation curve of Allan variance with average time. (a) Variation curve of CH4 concentration with average time; (b) Allan variance with average time
    Minghui Zhang, Lien Hu, Dan Yao, Yue Yang, Chuantao Zheng, Yiding Wang. Quartz Tuning Fork Enhanced Photoacoustic Spectroscopic Methane Detection System[J]. Acta Optica Sinica, 2020, 40(24): 2430001
    Download Citation