
Xiuhua Fu, Yixin Chen, Dongmei Liu, Jing Zhang, Cheng Lu. Development of Optical Films Based on Head-Mounted Display to Compensate for Gender Differences in Color Temperature of VR[J]. Acta Optica Sinica, 2021, 41(3): 0331001
- Acta Optica Sinica
- Vol. 41, Issue 3, 0331001 (2021)
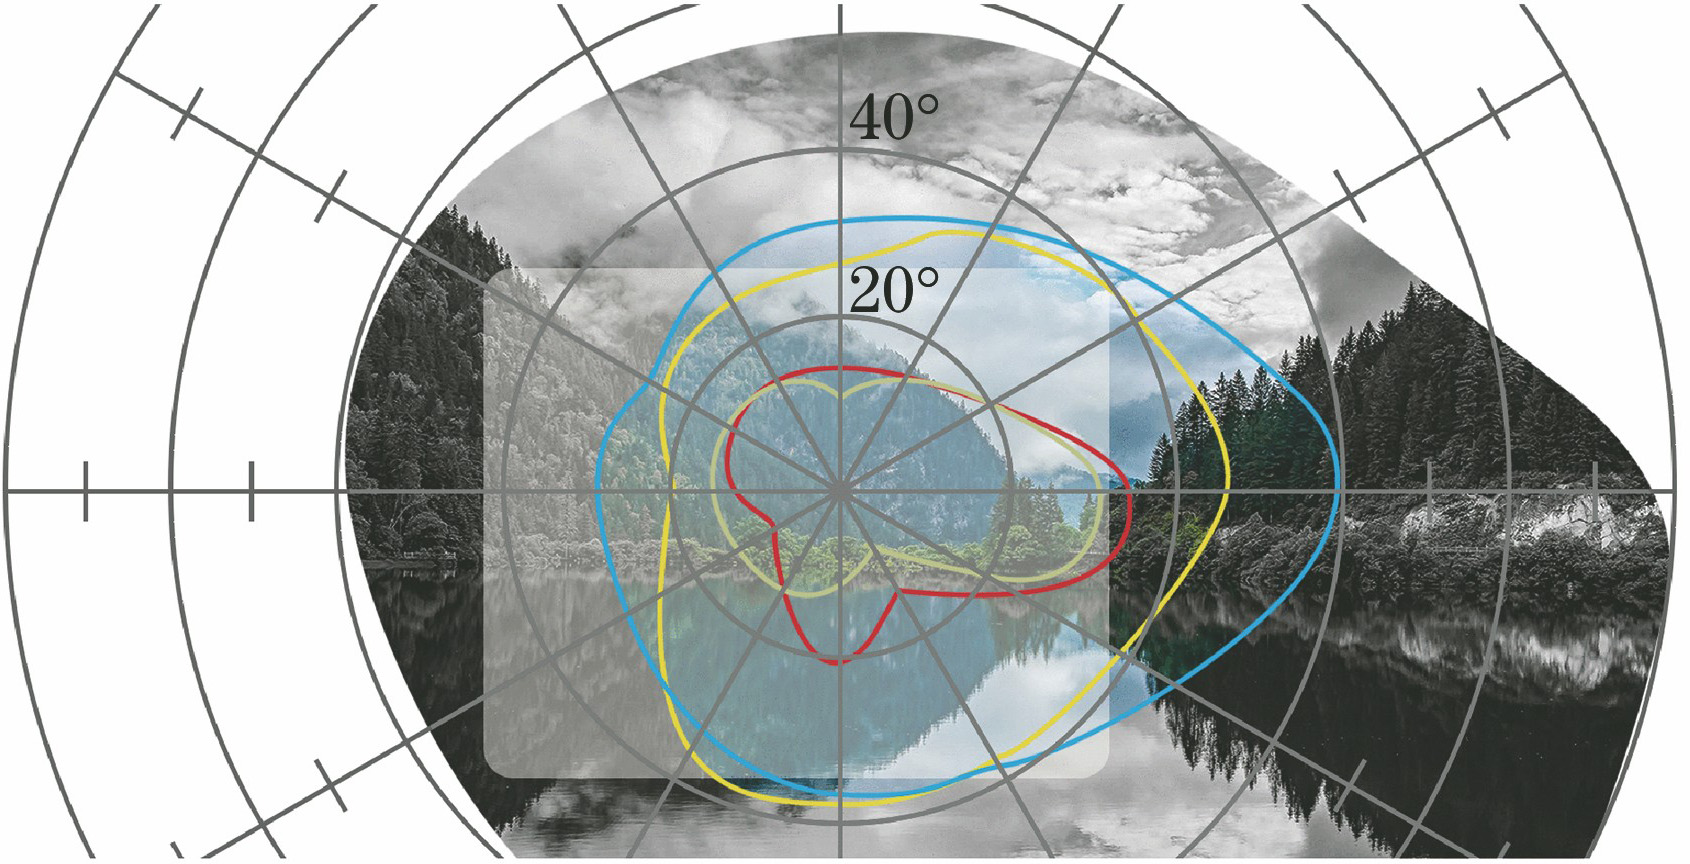
Fig. 1. Color perception of human eye versus incident angle of light source as well as HMD field of view
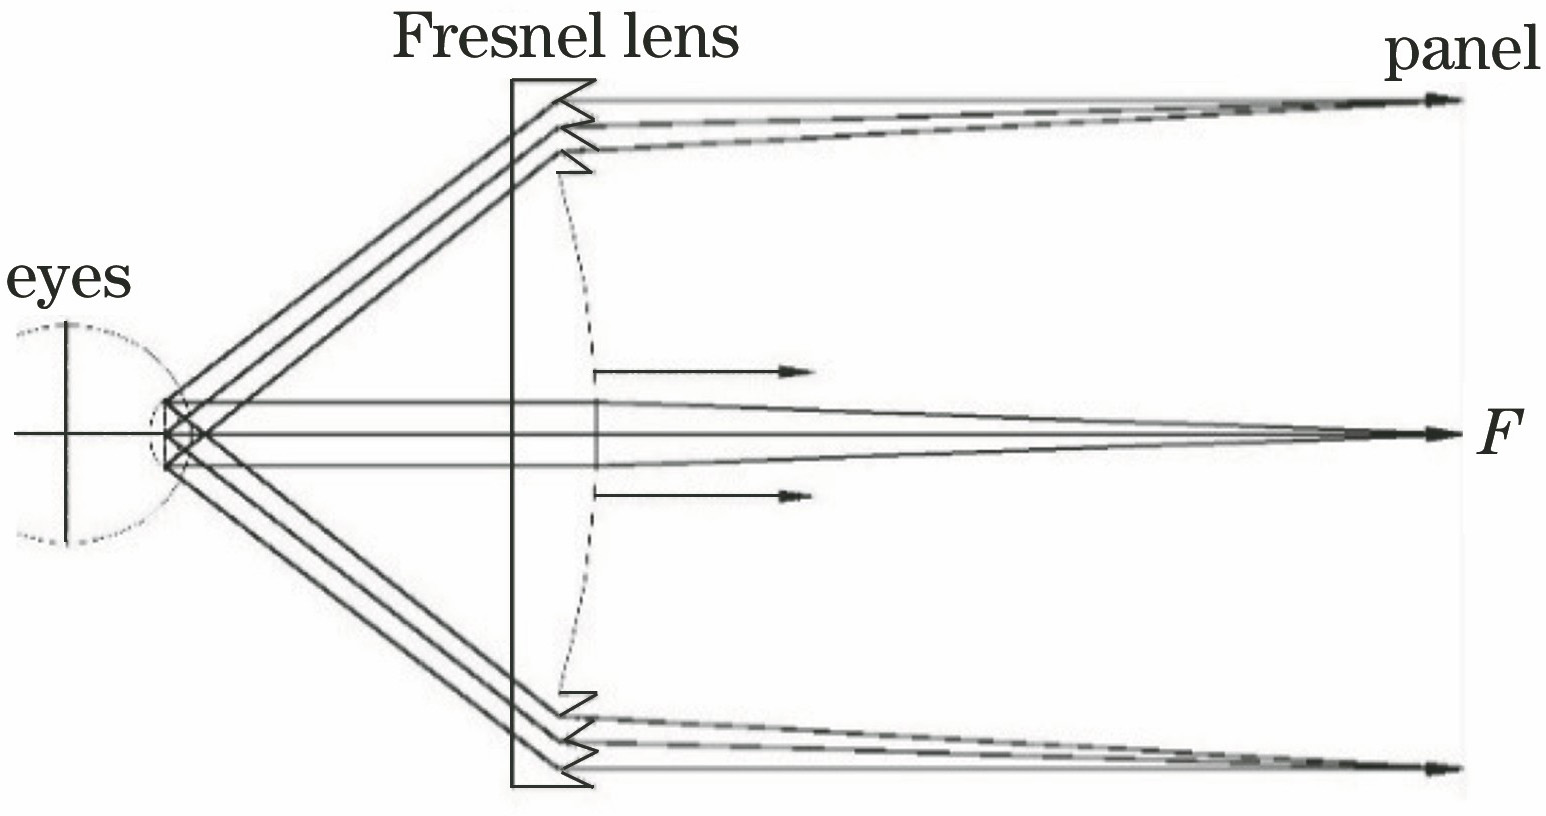
Fig. 2. HMD internal structure and light path
Fig. 3. Imaging optical path of Fresnel lens
Fig. 4. OLED relative spectral power distribution after normalization[12]
Fig. 5. 1931 CIE-XYZ chromaticity diagram[13]
Fig. 6. Isochromatic temperature lines and intersection points on blackbody radiation trajectory in chromaticity diagram[13]
Fig. 7. Spectrum at each transmittance
Fig. 8. Transmission spectral test curves forsix groups of filters
Fig. 9. Value of conversion coefficient Kx of two-band monochromatic light
Fig. 10. Value of conversion coefficient Ky of two-band monochromatic light
Fig. 11. Spectral transmittance curves of single-sided antireflection coatings on bases with different refractive indexes
Fig. 12. Influence of incident angle on theoretical transmission spectral curve for each color temperature. (a) 4876 K; (b) 9333 K
Fig. 13. Influence of incidence angle on theoretical spectral curve for each color temperature. (a) 4876 K; (b) 9333 K
Fig. 14. Theoretical and actual transmittance curves under different color temperatures when K9 is used as substrate
Fig. 15. Influence of incident angle on test spectral curve under different color temperatures. (a) 4876 K; (b) 9333 K
| ||||||||||||||||||||||||
Table 1. 0 Spectral actual color temperature value and contrast error for each substrate
|
Table 1. Three-band area ratio and color temperature corresponding to each transmittance
| |||||||||||||||||||||||||||||||||||||||||||||||||||||||||||||||||||||||||||||||
Table 2. Gaussian function coefficient values after spectral curve fitting for i=1--3
| |||||||||||||||||||||||||||||||||||||||||||||||||||||||||||||||||||||||||||||||
Table 3. Gaussian function coefficient values after spectral curve fitting for i=4--6
|
Table 4. Area ratios of six groups of functions and their corresponding color temperatures
|
Table 5. Average transmittance corresponding to bases with different refractive indexes
|
Table 6. Average transmittance, three-band area ratios, and normalized color temperatures of single-sided antireflection coatings on bases with different refractive indexes
|
Table 7. Normalized spectral area ratios corresponding to three bands for 4876 K/9333 K
|
Table 8. Spectral transmittance ratios corresponding to three bands for 4876 K/9333 K
|
Table 9. Coating process parameters for Ti3O5/ SiO2

Set citation alerts for the article
Please enter your email address
© Copyright 2018-2021 | Chinese Laser Press. All Rights Reserved 沪ICP备15018463号-20