
Wei DU, Yue LI, Pei HE, Jiaqi ZHANG, Haichao JING, Cheng NIE, Yinghui LIU. Nitrogen Addition Decreases Soil Respiration without Changing the Temperature Sensitivity in a Semiarid Grassland[J]. Journal of Resources and Ecology, 2020, 11(2): 129
- Journal of Resources and Ecology
- Vol. 11, Issue 2, 129 (2020)
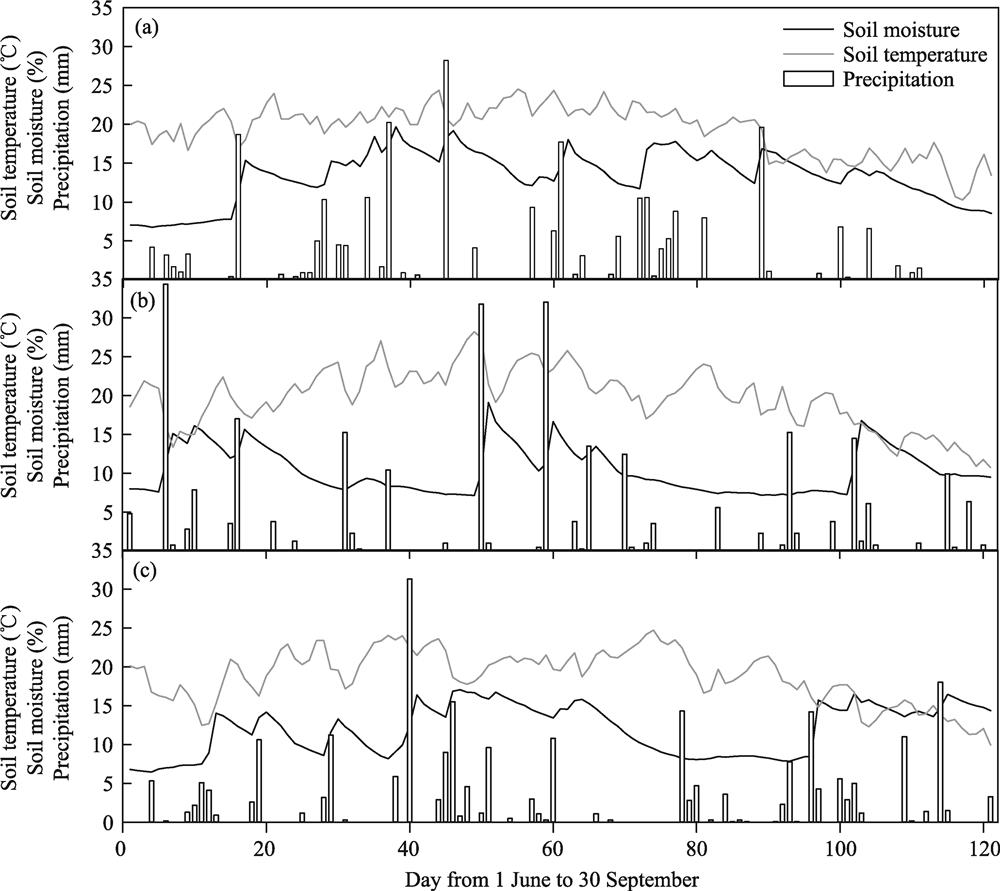
Fig. 1. Dynamics of soil temperature and soil moisture for 0-20 cm surface soil and precipitation during the growing seasons of 2013 (a), 2014 (b), and 2015 (c).
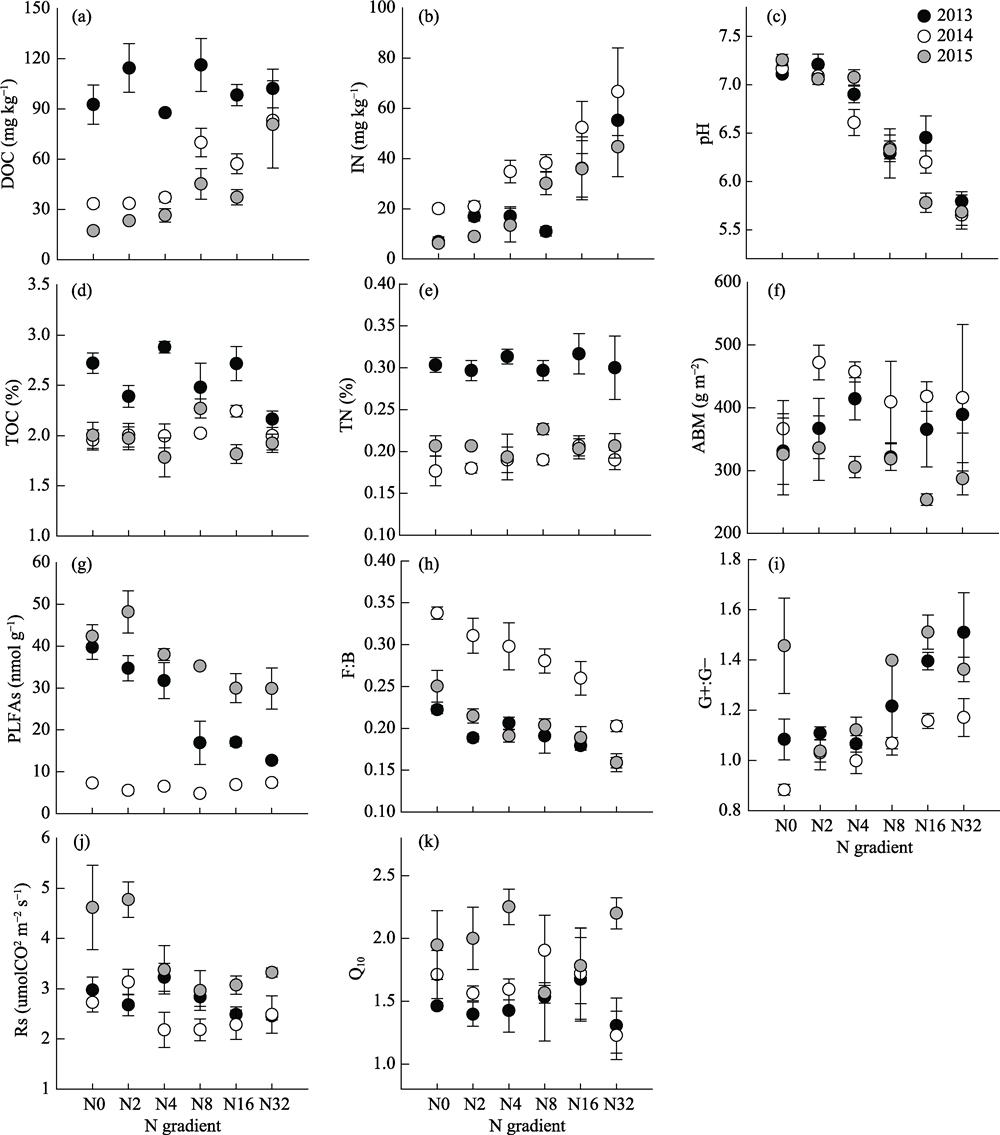
Fig. 2. Soil variables with six N gradients and three years (n =3) Note: (a) Dissolved organic carbon; (b) Inorganic nitrogen; (c) Ph; (d) Total organic carbon; (e) Total nitrogen; (f) Aboveground biomass; (g) PLFAs; (h) Fungi to bacteria ratio; (i) Gram-positive bacteria to gram-negative bacteria ratio; (j) Soil respiration; (k) Q 10.
Fig. 3. Principal component analysis of microbial community composition in soil samples with six N gradients and three years (mean±SE) (n =3). Soil samples in the three years are presented by different colors, as black indicates 2013, white indicates 2014, and grey indicates 2015.
Fig. 4. Structural equation model for the effects of nitrogen addition, soil temperature and soil moisture on soil pH, C and N availability, aboveground biomass, total PLFAs, microbial composition, Rs and Q10. Note: Dashed, red, and blue paths indicate the effect is insignificant, positive, and negative, respectively. The width of the arrow indicates the magnitude of the standardized path coefficient. Bold and italic-typed values indicate the proportions of the variance explained for each variable. χ 2—chi-square, df —degrees of freedom, P — P value, RMSEA —root mean square error of approximation, CFI —comparative fit index.
|
Table 1.
Loadings of microbial compositions and C and N availability with PC1 in principal component analysis on soil samples with six N addition levels and three years
|
Table 2.
Pearson correlation analysis of soil respiration and the impact factors
|
Table 3.
Standardized total effects in structural equation models

Set citation alerts for the article
Please enter your email address
© Copyright 2018-2021 | Chinese Laser Press. All Rights Reserved 沪ICP备15018463号-20