
Wei DU, Yue LI, Pei HE, Jiaqi ZHANG, Haichao JING, Cheng NIE, Yinghui LIU. Nitrogen Addition Decreases Soil Respiration without Changing the Temperature Sensitivity in a Semiarid Grassland[J]. Journal of Resources and Ecology, 2020, 11(2): 129
- Journal of Resources and Ecology
- Vol. 11, Issue 2, 129 (2020)
Abstract
Keywords
1 Introduction
Nitrogen (N) is one of the basic elements for organisms, and anthropogenic N deposition has become the largest N input at the global scale (
Rs includes both autotrophic and heterotrophic respiration. Autotrophic respiration mainly derives from roots, mycorrhizal fungi, and rhizosphere microorganisms. Therefore, N addition can increase Rs by enhancing root biomass (
Long-term experiments with large ranges of N addition concentrations are scarce in grasslands in China. As reviewed by
2 Materials and methods
2.1 Study area
The study area is in Duolun County, Inner Mongolia, China (42.02°N, 116.17°E; 1341 m). The mean annual temperature in this region is 2.1 ℃, and the mean annual precipitation is 385.5 mm, most of which falls between May and September (
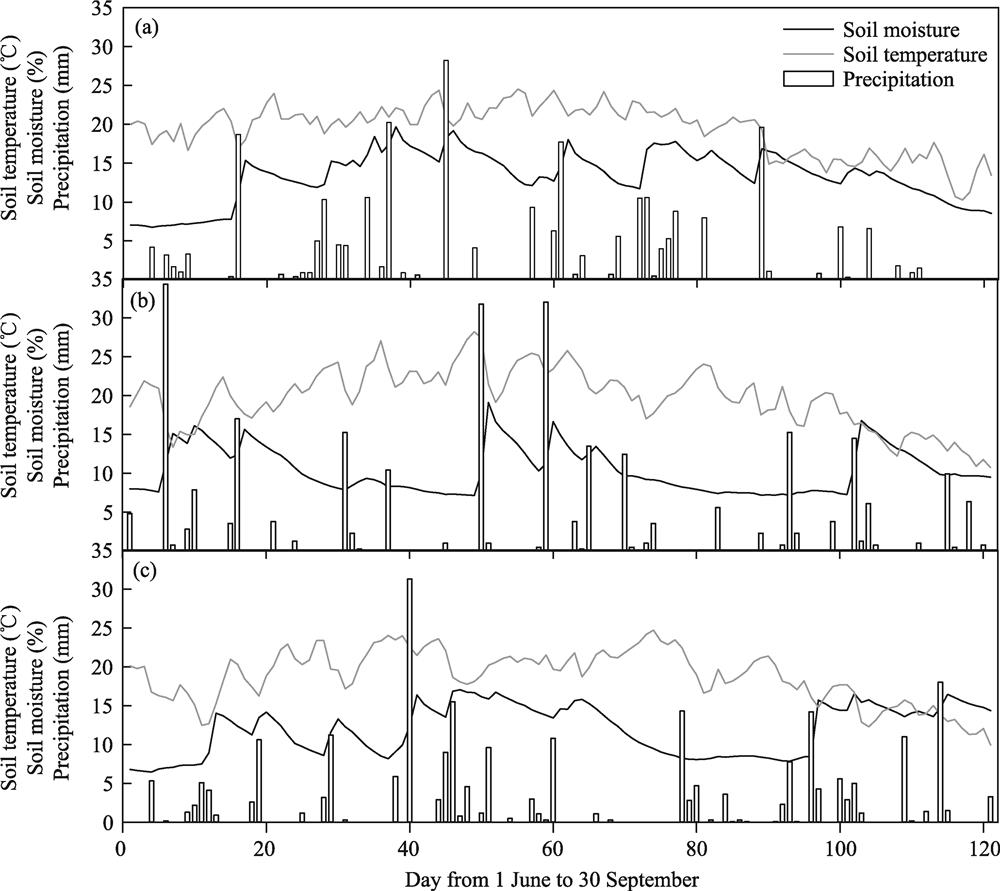
The mean soil temperatures for the three growing seasons of 2013, 2014 and 2015 were 19.4 ℃, 19.8 ℃, and 18.8 ℃, respectively. The mean soil moisture levels (soil volumetric water content, VWC) for the three growing seasons were 13.4%, 10.4%, and 11.9%, respectively. Soil volumetric water content was closely associated with precipitation events (
2.2 Experimental design
Atmospheric N deposition plus fertilizer application in this area are about 5 g N m-2 yr-1 (
2.3 Soil respiration
A PVC collar (20 cm diameter, 14 cm height) was inserted 5-6 cm deep at random locations in each plot to measure soil respiration (Rs, μmol of CO2 m-2 s-1). Aboveground biomass in the collar was clipped and removed 24 h before the measurement. All collars were removed after the measurement, and new ones were randomly insert into the soil during the next year. Respiration was measured during approximately 14-day periods in the mid-growing period, from 23 July to 4 August in 2013, from 27 July to 8 August in 2014, and from 26 July to 5 August in 2015. The Rs measurements would be postponed for 1-2 days after precipitation to avoid CO2 flux pulses. During each period, the 18 plots were each observed only once. The Rs values in three plots with six collars were measured on each date. The respiration rate was measured with a soil C-flux automatic measurement system (LI-COR, NE, USA), and data were recorded once every 1 h for each 24-h measurement period. The annual mean of Rs was used for subsequent analysis. In the meantime, soil temperature (℃) and moisture (%) in the top 0-10 cm layer of the soil near the collar were measured with an auxiliary sensor attached to the LI-COR 8150.
![]()
Figure 1.Dynamics of soil temperature and soil moisture for 0-20 cm surface soil and precipitation during the growing seasons of 2013 (a), 2014 (b), and 2015 (c).
A soil sensor attached to a data logger (EM50; ICT International, Australia) in the experimental site recorded the soil temperature and volumetric water content at a 10-cm depth. Data were recorded every hour during the growing season (June to September). Precipitation events at the site were recorded by the staff working in the Duolun Restoration Ecology Research Station.
2.4 Soil properties and aboveground biomass
Soil sampling was conducted during the soil respiration measurements in each year. Three 0-20 cm surface soil samples were randomly collected from each plot to form a composite sample. The soil pH, dissolved organic carbon (DOC), ammonium nitrogen (NH4+-N), and nitrate nitrogen (NO3--N) were measured. Fresh soil was sieved through 2-mm-pore filters and stored at 4 ℃ for PLFAs, pH, DOC, NH4+-N, and NO3--N measurements. To measure the DOC, a 0.5 M K2SO4 solution was used to extract soil organic carbon. The extracts were measured with a TOC analyzer (Liqui TOC II, Elementar, Germany). Ion chromatograph analyzers were used to measure inorganic ions such as NH4+-N and NO3--N (DX-600 and ICS-2100, Dionex, CA, USA), and inorganic nitrogen (IN) was calculated as the sum of NH4+-N and NO3--N. The other portion of each soil sample was air dried and then ground for soil total organic carbon (TOC) and total nitrogen (TN) measurements. TOC was measured by the potassium dichromate-oxidation method, and TN was analyzed with an elemental analyzer (Perkin-Elmer, MA, USA). Aboveground biomass (ABM) in one quadrat (1 m × 1 m) of each plot was clipped and determined as described by
2.5 Soil phospholipid fatty acids
The microbial composition was measured in fresh soil using PLFAs as described by Bossio and Scow (1998). For comparisons to be valid among years, 18 biomarkers (i14:0, i15:0, a15:0, i16:0, a16:0, 16:1w5c, 16:0, i17:0, a17:0, 17:1w8c, cy17:0, 10Me17:0, 18:2w6c, 18:1w9c, 18:1w7c, 18:1w5c, 18:0, and 10Me18:0) that existed in all three years were selected, and the proportions of the individual PLFA biomarkers (i.e., the ratios of the selected biomarker to the total PLFAs that existed in a growing season) were used for further analysis. According to previous studies, i14:0, i15:0, a15:0, i16:0, a16:0, 16:0, 16:0, i17:0, a17:0, cy17:0, 17:1w8c, 18:1w7c, 18:1w5c, and 18:0 indicate bacteria; 18:2w6c and 18:1w9c indicate fungi; 10Me17:0 and 10Me18:0 indicate actinomycetes; i14:0, i15:0, a15:0, i16:0, i17:0, and a17:0 indicate gram-positive bacteria; a16:0, 17:1w8c, cy17:0, 18:1w7c, and 18:1w5c indicate gram- negative bacteria; and 16:1w5c indicates arbuscular mycorrhizal fungi (AMF) (
2.6 Statistical analysis
Temperature sensitivity of soil respiration (
where
Two-way ANOVA was used to evaluate the effects of N addition and interannual variability on
SPSS 20.0 was used to perform a principal component analysis (PCA) on microbial composition (measured by the proportions of individual PLFA biomarkers) in soil samples in the six N addition levels and three years. Graphs were created using SigmaPlot 12.5 (Systat Software, CA, USA).
A structural equation model (SEM) was used to assess the direct and indirect effects of N addition on microbial community, soil respiration, and
In light of the complexity of defining the microbial community, we quantified such variables in each model as follows: “PLFAs” and “microbial composition”. Prior to the path analysis, PCA was performed for the indicators representing “microbial composition” and “C and N availability”, respectively, then the loading of PC1 was used in the model (
3 Results
3.1 Soil properties and aboveground biomass
The DOC and IN show significant differences along the N gradient (Table S1,
| Factor | PC1 |
|---|---|
| PLFA biomarkers | |
| i14:0 | 0.050 |
| i15:0 | -0.358 |
| a15:0 | -0.687 |
| i16:0 | -0.572 |
| a16:0 | -0.718 |
| 16:1 w7c | 0.055 |
| 16:1 w5c | 0.699 |
| 16:0 | 0.108 |
| i17:0 | -0.551 |
| a17:0 | -0.492 |
| 17:1 w8c | 0.216 |
| cy17:0 | -0.474 |
| 10Me17:0 | 0.377 |
| 18:2 w6,9c | 0.679 |
| 18:1 w9c | 0.679 |
| 18:1 w7c | 0.412 |
| 18:1 w5c | 0.866 |
| 18:0 | 0.685 |
| 10Me18:0 | 0.701 |
| C and N availability | |
| DOC | 0.824 |
| TOC | 0.872 |
| TN | 0.949 |
Table 1.
Loadings of microbial compositions and C and N availability with PC1 in principal component analysis on soil samples with six N addition levels and three years
3.2 Soil microbial phospholipid fatty acids
In the three growing seasons, the PLFA biomarkers selected in this study accounted for 64%-69% of the total nitrogen gradients, with the sum of the leading five markers (16:0, 18:1w7c, 18:1w9c, i15 :0 and i16:0, all of which are bacterial biomarkers) accounting for 36%-40% of the total. Soil PLFAs had significant differences between N gradients (Table S1,
![]()
Figure 2.Soil variables with six N gradients and three years (
Principal component analysis was used to determine the relationships between soil microbial communities. Soil samples with decreasing N gradients were generally distributed from left to right along PC1, indicating that PC1 was related to N addition rate. In addition, samples in 2015 were allocated in the ordination plot where PC2 啊啊啊 0, but the opposite was found for samples in 2013 and 2014. These patterns implied that interannual variability was associated with PC2. The two axes explained 51.56% of the variation of the microbial community composition in the soil samples (
![]()
Figure 3.Principal component analysis of microbial community composition in soil samples with six N gradients and three years (mean±SE) (
3.3
Rs shows significant differences between N gradients (
3.4 Relationships between soil respiration and the various impact factors
Pearson correlation analysis showed that
Two SEM models were constructed using the two microbial community indicators of soil PLFAs and microbial community composition. The models explained the variation between 62% and 65% for Rs and 52% for
| N | ST | SM | pH | DOC | IN | TOC | TN | ABM | PLFAs | F:B | G+:G- | |||
|---|---|---|---|---|---|---|---|---|---|---|---|---|---|---|
| N | 1 | |||||||||||||
| ST | 0.165 | 1 | ||||||||||||
| SM | -0.083 | -0.308* | 1 | |||||||||||
| pH | -0.861** | -0.038 | -0.013 | 1 | ||||||||||
| DOC | 0.352** | 0.277* | -0.365** | -0.277* | 1 | |||||||||
| IN | 0.729** | 0.126 | -0.100 | -0.690** | 0.209 | 1 | ||||||||
| TOC | -0.137 | 0.309* | -0.260 | 0.174 | 0.501** | -0.143 | 1 | |||||||
| TN | 0.031 | 0.260 | -0.267 | 0.043 | 0.702** | -0.099 | 0.795** | 1 | ||||||
| ABM | -0.041 | 0.136 | -0.115 | 0.064 | 0.071 | 0.138 | 0.081 | -0.101 | 1 | |||||
| PLFAs | -0.298* | -0.091 | 0.395** | 0.366** | -0.124 | -0.493** | 0.096 | 0.220 | -0.452** | 1 | ||||
| F:B | -0.504** | -0.124 | -0.039 | 0.417** | -0.469** | -0.138 | -0.202 | -0.500** | 0.378** | -0.432** | 1 | |||
| G+:G- | 0.455** | -0.147 | 0.152 | -0.472** | 0.116 | 0.280* | -0.080 | 0.188 | -0.259 | 0.153 | -0.543** | 1 | ||
| -0.271* | 0.137 | 0.510** | 0.323* | -0.366** | -0.334* | -0.068 | -0.059 | -0.179 | 0.608** | -0.119 | 0.039 | 1 | ||
| -0.089 | -0.309* | 0.718** | 0.058 | -0.358** | -0.043 | -0.243 | -0.273* | -0.011 | 0.255 | 0.030 | 0.016 | 0.436** | 1 |
Table 2.
Pearson correlation analysis of soil respiration and the impact factors
From the standard total effect coefficient, N addition inhibited Rs, but had less effect on
![]()
Figure 4.Structural equation model for the effects of nitrogen addition, soil temperature and soil moisture on soil pH, C and N availability, aboveground biomass, total PLFAs, microbial composition, Rs and Q10. Note: Dashed, red, and blue paths indicate the effect is insignificant, positive, and negative, respectively. The width of the arrow indicates the magnitude of the standardized path coefficient. Bold and italic-typed values indicate the proportions of the variance explained for each variable.
4 Discussion
4.1 The responses of soil properties and soil microbial community to N addition
After urea fertilizer is hydrolyzed to NH4+-N, the soil pH decreases because NH4+-N is transformed into NO3--N and H+ is released into the soil (
| Factor | N | ST | SM | pH | CN | ABM | PLFAs | Microbial composition |
|---|---|---|---|---|---|---|---|---|
| ABM | -0.07 | 0.13 | -0.08 | 0.04 | -0.06 | N/A | N/A | N/A |
| PLFAs | -0.27 | -0.03 | 0.37 | 0.55 | 0.25 | -0.44 | N/A | N/A |
| Microbial composition | -0.61 | 0.10 | -0.30 | 0.19 | -0.21 | 0.39 | N/A | N/A |
| -0.27 | 0.33 | 0.56 | 0.40 | -0.09 | -0.18 | 0.42 | N/A | |
| -0.02 | -0.08 | 0.71 | 0.02 | -0.08 | 0.08 | 0.04 | N/A | |
| -0.25 | 0.33 | 0.56 | 0.47 | -0.09 | -0.18 | N/A | -0.36 | |
| -0.04 | -0.08 | 0.71 | 0.01 | -0.08 | 0.08 | N/A | 0.05 |
Table 3.
Standardized total effects in structural equation models
As commonly occurrs in N saturation conditions, the DOC is expected to decrease when C becomes the limiting factor (
The groupings of the samples as explained by the first ordination axis in the PCA revealed the impact of N fertilization on the soil microbial composition in this semiarid grassland soil. In agreement with Zhou et al. (2017), when N was added to the soil, bacterial communities outcompeted saprophytic fungal communities, and gram-positive bacteria outcompeted gram-negative bacteria. Consistent with Wei et al. (2013), the decrease of the F : B ratio with N addition was mainly caused by a decrease in the fungi biomarker. The soil pH preferences among microbial communities have been inconsistent among studies (
4.2 The responses of
Rs includes the respiration of soil microorganisms, plant roots, soil animals, etc., and was affected by many factors such as soil temperature and moisture, soil physical and chemical properties, aboveground and underground biomass of vegetation, and soil microbial community. N addition had a negative effect on Rs in this grassland soil. However, this is not necessarily inconsistent with the reviews in which Rs increased by N addition (
5 Conclusion
Soil microbial composition in the grassland ecosystem was changed by added N, as gram-positive bacteria grew to dominate the microbial communities by outcompeting gram-negative bacteria and saprophytic fungi. N addition reduced Rs by reducing soil pH, reducing soil PLFAs and changing microbial community composition. However, Q10 was not significantly affected by N addition, indicating that there is no contribution of N addition to further SOC loss under global warming in this grassland soil.
Table S1 Soil variables averaged for the three years (mean±SE) (
Table S2 Soil variables averaged for the six N gradients (mean±SE) (
References
[1] Ali RS, KandelerE, MarhanS et al. Controls on microbially relegated soil organic carbon decomposition at the regional scale. Soil Biology and Biochemistry, 118, 59-68(2018).
[2] BiJ, ZhangN, LiangY et al. Interactive effects of water and nitrogen addition on soil microbial communities in a semiarid steppe. Journal of Plant Ecology, 5, 320-329(2012).
[3] Bossio DA, Scow KM. Impacts of carbon and flooding on soil microbial communities: Phospholipid fatty acid profiles and substrate utilization patterns. Microbial Ecology, 35, 265-278(1998).
[4] CanariniA, Kiar LP, Dijkstra FA. Soil carbon loss regulated by drought intensity and available substrate: A meta-analysis. Soil Biology and Biochemistry, 112, 90-99(2017).
[5] Cenini VL, Fornara DA, McMullanG et al. Chronic nitrogen fertilization and carbon sequestration in grassland soils: Evidence of a microbial enzyme link. Biogeochemistry, 126, 301-313(2015).
[6] Chapin FS, MatsonP. Principles of terrestrial ecosystem ecology. New York:. Springer.(2002).
[7] ChenD, LanZ, HuS et al. Effects of nitrogen enrichment on belowground communities in grassland: Relative role of soil nitrogen availability vs. soil acidification. Soil Biology and Biochemistry, 89, 99-108(2015).
[8] ChengS, HeS, FangH et al. Contrasting effects of NH4 + and NO3 - amendments on amount and chemical characteristics of different density organic matter fractions in a boreal forest soil. Geoderma, 293, 1-9(2017).
[9] Evans CD, Goodale CL, S JM et al. Does elevated nitrogen deposition or ecosystem recovery from acidification drive increased dissolved organic carbon loss from upland soil? A review of evidence from field nitrogen addition experiments. Biogeochemistry, 91, 13-35(2008).
[10] FangC, LiF, PeiJ et al. Impacts of warming and nitrogen addition on soil autotrophic and heterotrophic respiration in a semi-arid environment. Agricultural and Forest Meteorology, 248, 449-457(2018).
[11] FangY, XunF, BaiW et al. Long-term nitrogen addition leads to loss of species richness due to litter accumulation and soil acidification in a temperate steppe. Plos One, 7, e47369(2012).
[12] FuZ, NiuS, Dukes JS. What have we learned from global change manipulative experiments in China? A meta-analysis. Scientific Reports, 5, 12344(2015).
[13] GruberN, Galloway JN. An earth-system perspective of the global nitrogen cycle. Nature, 451, 293-296(2008).
[14] KaurA, ChaudharyA, KaurA et al. Phospholipid fatty acid - A bioindicator of environment monitoring and assessment in soil ecosystem. Current Science, 89, 1103-1112(2005).
[15] Kopá?ekJ, Cosby BJ, Evans CD. et al. 2013. Nitrogen, organic carbon and sulphur cycling in terrestrial ecosystems: Linking nitrogen saturation to carbon limitation of soil microbial processes. Biogeochemistry, 115, 33-51.
[16] Lennon JT, Aanderud ZT, Lehmkuhl BK. et al. 2012. Mapping the niche space of soil microorganisms using taxonomy and traits. Ecology, 93, 1867-1879.
[17] LiY, Liu YH, Wu SM et al. Microbial properties explain temporal variation in soil respiration in a grassland subjected to nitrogen addition. Scientific Reports, 5, 18496(2015).
[18] LiY, SunJ, TianD et al. Soil acid cations induced reduction in soil respiration under nitrogen enrichment and soil acidification. Science of the Total Environment, 615, 1535-1546(2018).
[19] LiuP, Sun OJ et al. Litter decomposition and nutrient release as affected by soil nitrogen availability and litter quality in a semiarid grassland ecosystem. Oecologia, 162, 771-780(2010).
[20] LiuY, LiuS, WanS et al. Differential responses of soil respiration to soil warming and experimental throughfall reduction in a transitional oak forest in central China. Agricultural and Forest Meteorology, 226-, 227, 186-198(2016).
[21] ManzoniS, Schimel JP, PorporatoA. Responses of soil microbial communities to water stress: Results from a meta-analysis. Ecology, 93, 930-938(2012).
[22] Moyano FE, ManzoniS, ChenuC. Responses of soil heterotrophic respiration to moisture availability: An exploration of processes and models. Soil Biology and Biochemistry, 59, 72-85(2013).
[23] NiuS, YangH, ZhangZ et al. Non-additive effects of water and nitrogen addition on ecosystem carbon exchange in a temperate steppe. Ecosystems, 12, 915-926(2009).
[24] Ramirez KS, Craine JM, FiererN. Nitrogen fertilization inhibits soil microbial respiration regardless of the form of nitrogen applied. Soil Biology and Biochemistry, 42, 2336-2338(2010).
[25] Riggs CE, Hobbie SE. Mechanisms driving the soil organic matter decomposition response to nitrogen enrichment in grassland soils. Soil Biology and Biochemistry, 99, 54-65(2016).
[26] RodriguezA, Lovett GM, Weathers KC et al. Lability of C in temperate forest soils: Assessing the role of nitrogen addition and tree species composition. Soil Biology and Biochemistry, 77, 129-140(2014).
[27] Schermelleh-EngelK, MoosbruggerH, MüllerH. Evaluating the fit of structural equation models: Tests of significance and descriptive goodness-of-fit measures. Methods of Psychological Research Online, 8, 23-74(2003).
[28] Schimel JP, Balser TC, WallensteinM. Microbial stress-response physiology and its implications for ecosystem function. Ecology, 88, 1386-1394(2007).
[29] Soil SurveyStaff. Keys to soil taxonomy, 12th ed. Washington DC:. USDA-Natural Resources Conservation Service.(2014).
[30] Soil Taxonomy ResearchGroup, Institute of SoilScience, Chinese Academy ofSciences. The Chinese soil taxonomic classification retrieval. Hefei:.Press of University of Science and Technology of China(2001).
[31] SongB, NiuS, LiL et al. Soil carbon fractions in grasslands respond differently to various levels of nitrogen enrichments. Plant and Soil, 384, 401-412(2014).
[32] TahovskáK, KaňaJ, BártaJ et al. Microbial N immobilization is of great importance in acidified mountain spruce forest soils. Soil Biology and Biochemistry, 59, 58-71(2013).
[33] TianD, NiuS. A global analysis of soil acidification caused by nitrogen addition. Environmental Research Letters, 10, 024019(2015).
[34] TianQ, LiuN, BaiW et al. A novel soil manganese mechanism drives plant species loss with increased nitrogen deposition in a temperate steppe. Ecology, 97, 65-74(2016).
[35] Treseder KK. Nitrogen additions and microbial biomass: A meta-analysis of ecosystem studies. Ecology letters, 11, 1111-1120(2008).
[36] Treseder KK, Kivlin SN, Hawkes CV. Evolutionary trade-offs among decomposers determine responses to nitrogen enrichment. Ecology letters, 14, 933-938(2011).
[37] WangR, DorodnikovM, Dijkstra FA et al. Sensitivities to nitrogen and water addition vary among microbial groups within soil aggregates in a semiarid grassland. Biology and Fertility of Soils, 53, 129-140(2017).
[38] WangR, DorodnikovM, YangS et al. Responses of enzymatic activities within soil aggregates to 9-year nitrogen and water addition in a semi-arid grassland. Soil Biology and Biochemistry, 81, 159-167(2015).
[39] Wang YK, Liu SE, TianP. Carbon quality and soil microbial property control the latitudinal pattern in temperature sensitivity of soil microbial respiration across Chinese forest ecosystems. Global Change Biology, 24, 2841-2849(2018).
[40] WeiC, YuQ, BaiE et al. Nitrogen deposition weakens plant-microbe interactions in grassland ecosystems. Global Change Biology, 19, 3688-3697(2013).
[41] WenJ, Zhou HK, Yao BQ. et al. 2014. Characteristics of soil respiration in different degraded alpine grassland in the source region of Three-River. Chinese Journal of Plant Ecology, 38, 209-218.
[42] XuW, WanS. Water- and plant-mediated responses of soil respiration to topography, fire, and nitrogen fertilization in a semiarid grassland in northern China. Soil Biology and Biochemistry, 40, 679-687(2008).
[43] YangQ, XuM, LiuH et al. Impact factors and uncertainties of the temperature sensitivity of soil respiration. Acta Ecologica Sinica, 31, 2301-2311(2011).
[44] YueK, PengY, PengC et al. Stimulation of terrestrial ecosystem carbon storage by nitrogen addition: A meta-analysis. Scientific Reports, 6, 19895(2016).
[45] Zak DR, Pregitzer KS, Burton AJ et al. Microbial responses to a changing environment: Implications for the future functioning of terrestrial ecosystems. Fungal Ecology, 4, 386-395(2011).
[46] ZhalninaK, DiasR, de Quadros PD et al. Soil pH determines microbial diversity and composition in the park grass experiment. Microbial Ecology, 69, 395-406(2014).
[47] ZhangC, NiuD, Hall SJ et al. Effects of simulated nitrogen deposition on soil respiration components and their temperature sensitivities in a semiarid grassland. Soil Biology and Biochemistry, 75, 113-123(2014).
[48] ZhangN, WanS, GuoJ et al. Precipitation modifies the effects of warming and nitrogen addition on soil microbial communities in northern Chinese grasslands. Soil Biology and Biochemistry, 89, 12-23(2015).
[49] ZhongY, YanW, ShangguanZ. The effects of nitrogen enrichment on soil CO2 fluxes depending on temperature and soil properties. Global Ecology and Biogeography, 25, 475-488(2016).
[50] ZhouL, ZhouX, ZhangB et al. Different responses of soil respiration and its components to nitrogen addition among biomes: A meta-analysis. Global Change Biology, 20, 2332-2343(2014).
[51] ZhouZ, WangC, ZhengM et al. Patterns and mechanisms of responses by soil microbial communities to nitrogen addition. Soil Biology and Biochemistry, 115, 433-441(2017).
[52] ZhuC, MaY, WuH et al. Divergent effects of nitrogen addition on soil respiration in a semiarid grassland. Scientific Reports, 6, 33541(2016).


Set citation alerts for the article
Please enter your email address

© Copyright 2018-2021 | Chinese Laser Press. All Rights Reserved 沪ICP备15018463号-20