• Photonics Research
  • Vol. 9, Issue 9, 1719 (2021)
Yosuke Mizuno1、*, Antreas Theodosiou2, Kyriacos Kalli2, Sascha Liehr3, Heeyoung Lee4, and Kentaro Nakamura5
Author Affiliations
  • 1Faculty of Engineering, Yokohama National University, Yokohama 240-8501, Japan
  • 2Photonics and Optical Sensors Research Laboratory, Cyprus University of Technology, Limassol 3036, Cyprus
  • 3DiGOS Potsdam GmbH, Telegrafenberg, Potsdam 14473, Germany
  • 4College of Engineering, Shibaura Institute of Technology, Tokyo 135-8548, Japan
  • 5Institute of Innovative Research, Tokyo Institute of Technology, Yokohama 226-8503, Japan
  • show less
    DOI: 10.1364/PRJ.435143 Cite this Article Set citation alerts
    Yosuke Mizuno, Antreas Theodosiou, Kyriacos Kalli, Sascha Liehr, Heeyoung Lee, Kentaro Nakamura. Distributed polymer optical fiber sensors: a review and outlook[J]. Photonics Research, 2021, 9(9): 1719 Copy Citation Text show less
    Schematic examples for Rayleigh-based techniques. (a) Distributed Rayleigh backscatter analysis for the measurement of strain changes ε, temperature T, radiation, and RH. Length change measurement due to Fresnel reflection shift is indicated. (b) Examples for quasi-distributed sensing based on sensitized fiber sections or transducing elements. (c) Example for distributed strain sensing in PFGI-POFs and the evaluation of length change distribution from backscatter shift analysis.
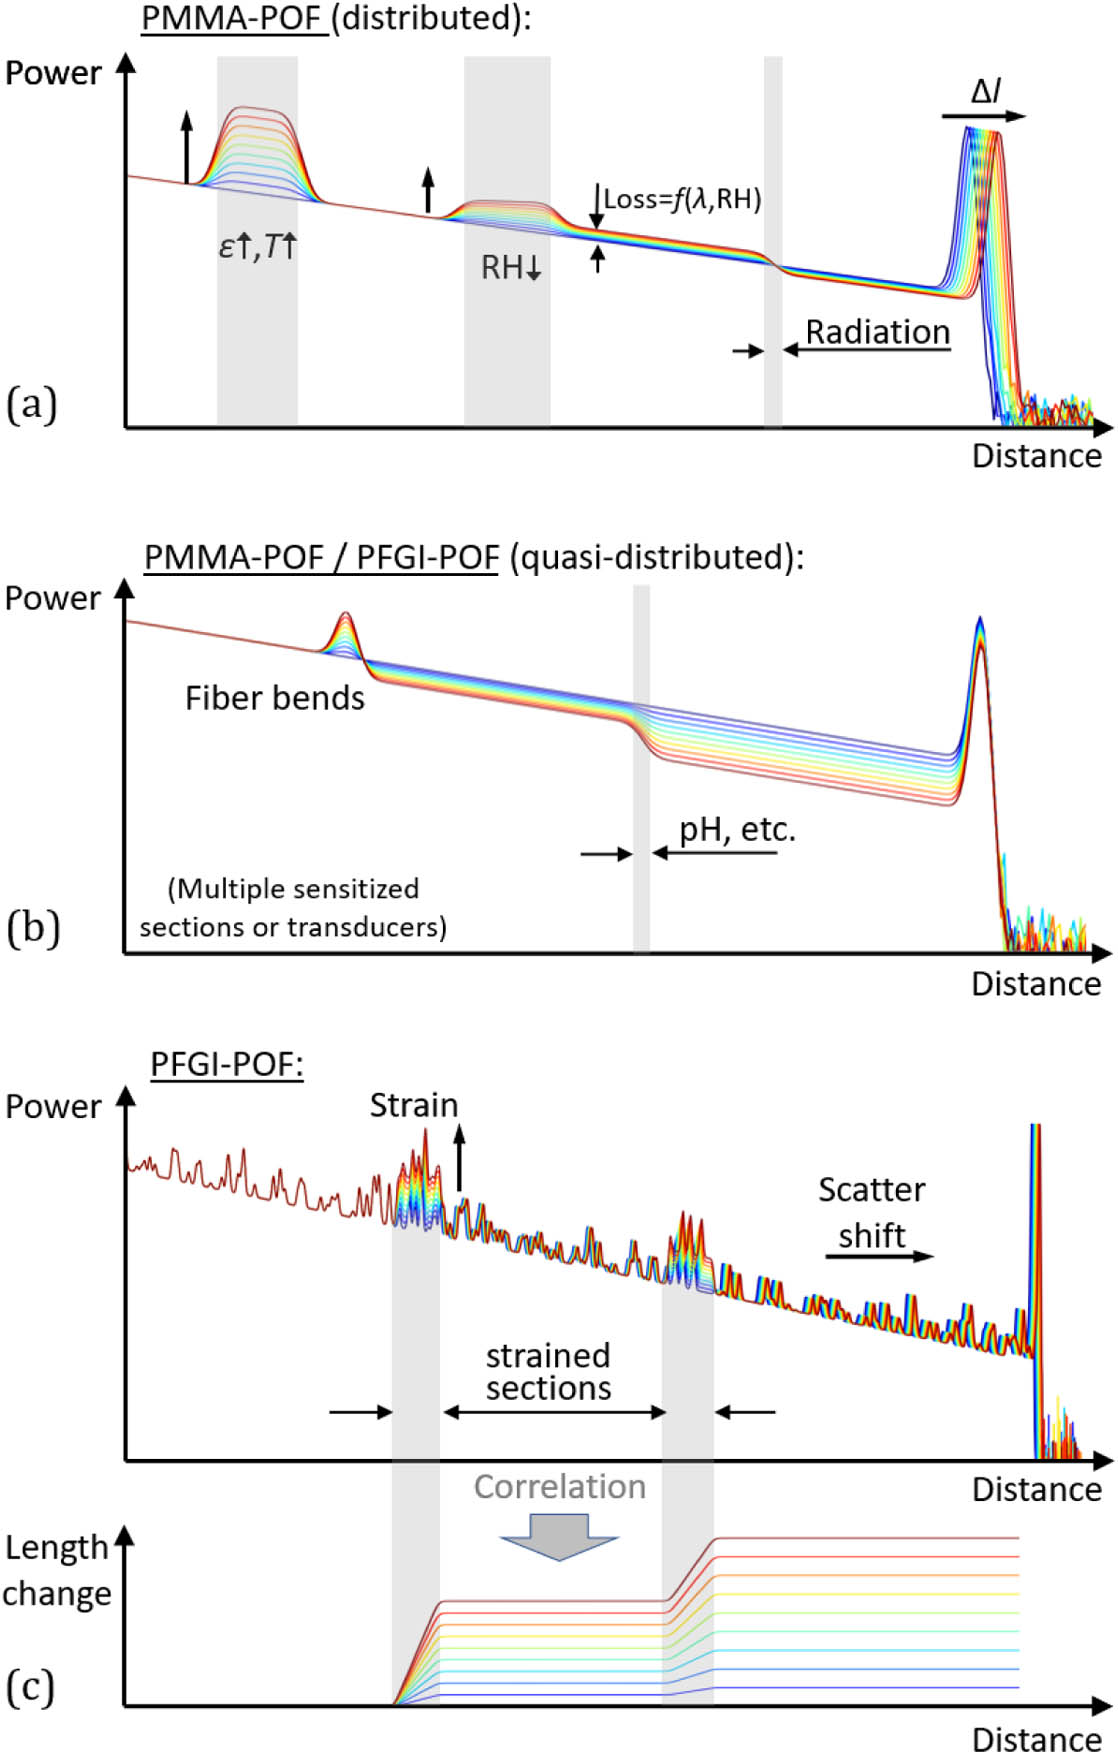
    Fig. 1. Schematic examples for Rayleigh-based techniques. (a) Distributed Rayleigh backscatter analysis for the measurement of strain changes ε, temperature T, radiation, and RH. Length change measurement due to Fresnel reflection shift is indicated. (b) Examples for quasi-distributed sensing based on sensitized fiber sections or transducing elements. (c) Example for distributed strain sensing in PFGI-POFs and the evaluation of length change distribution from backscatter shift analysis.
    Large-strain dependencies of (a) BGS and (b) BFS in a POF. Reproduced with permission from Ref. [115]. Copyright 2014, American Institute of Physics.
    Fig. 2. Large-strain dependencies of (a) BGS and (b) BFS in a POF. Reproduced with permission from Ref. [115]. Copyright 2014, American Institute of Physics.
    BFS distributions measured when a 50 m-long section was (a) strained and (b) heated. Reproduced with permission from Ref. [126]. Copyright 2014, IEEE.
    Fig. 3. BFS distributions measured when a 50 m-long section was (a) strained and (b) heated. Reproduced with permission from Ref. [126]. Copyright 2014, IEEE.
    Distributions of (a) BGS and (b) BFS, measured when a 10 cm-long section was heated. Reproduced with permission from Ref. [126]. Copyright 2014, IEEE.
    Fig. 4. Distributions of (a) BGS and (b) BFS, measured when a 10 cm-long section was heated. Reproduced with permission from Ref. [126]. Copyright 2014, IEEE.
    Distributions of (a) BGS and (b) BFS, measured by simplified BOCDR when a 46 cm-long section of the POF was heated. Reproduced with permission from Ref. [127]. Copyright 2015, IEEE.
    Fig. 5. Distributions of (a) BGS and (b) BFS, measured by simplified BOCDR when a 46 cm-long section of the POF was heated. Reproduced with permission from Ref. [127]. Copyright 2015, IEEE.
    Distributions of (a) BGS and (b) BFS, measured using a noise-suppression technique when a 1 m-long section was heated. Reproduced with permission from Ref. [128]. Copyright 2019, Optical Society of America.
    Fig. 6. Distributions of (a) BGS and (b) BFS, measured using a noise-suppression technique when a 1 m-long section was heated. Reproduced with permission from Ref. [128]. Copyright 2019, Optical Society of America.
    Temporal variations of (a) BGS and (b) BFS, measured when dynamic strain was applied to a 1 m-long section. Reproduced with permission from Ref. [128]. Copyright 2019, Optical Society of America.
    Fig. 7. Temporal variations of (a) BGS and (b) BFS, measured when dynamic strain was applied to a 1 m-long section. Reproduced with permission from Ref. [128]. Copyright 2019, Optical Society of America.
    Reflection spectra of a PFGI-POF-FBG with controlled FBG spatial dimensions using a femtosecond laser (plane-by-plane method). (a) Single-peak spectrum, (b) multiple-peak spectrum, (c) phase mask method, and (d) six-FBG array inscribed in a PFGI-POF using a femtosecond laser. Reproduced with permission from Refs. [134,136,137]. Copyright 2017, IEEE; 2018, IEEE; 2016, Elsevier.
    Fig. 8. Reflection spectra of a PFGI-POF-FBG with controlled FBG spatial dimensions using a femtosecond laser (plane-by-plane method). (a) Single-peak spectrum, (b) multiple-peak spectrum, (c) phase mask method, and (d) six-FBG array inscribed in a PFGI-POF using a femtosecond laser. Reproduced with permission from Refs. [134,136,137]. Copyright 2017, IEEE; 2018, IEEE; 2016, Elsevier.
    Wavelength responses of PFGI-POF-FBGs to (a) strain, (b) pressure, (c) temperature, and (d) RH. Reproduced with permission from Refs. [131,138,139]. Copyright 2020, Elsevier; 2017, IEEE; 2017, IEEE.
    Fig. 9. Wavelength responses of PFGI-POF-FBGs to (a) strain, (b) pressure, (c) temperature, and (d) RH. Reproduced with permission from Refs. [131,138,139]. Copyright 2020, Elsevier; 2017, IEEE; 2017, IEEE.
    (a) Experimental setup for monitoring the health condition of a cantilever beam. (b) Comparative vibration snapshot of the time-dependent wavelength response of a free-free metallic beam; measured using silica FBGs (blue) and PFGI-POF-FBGs (red) at the same position. Reproduced with permission from Refs. [134,139]. Copyright 2017, IEEE; 2017, IEEE.
    Fig. 10. (a) Experimental setup for monitoring the health condition of a cantilever beam. (b) Comparative vibration snapshot of the time-dependent wavelength response of a free-free metallic beam; measured using silica FBGs (blue) and PFGI-POF-FBGs (red) at the same position. Reproduced with permission from Refs. [134,139]. Copyright 2017, IEEE; 2017, IEEE.
    (a) Exoskeleton with the flexible supports positioned on the shank region. (b) Schematic representation of the assembled flexible support using a PFGI-POF-FBG array, acrylonitrile butadiene styrene (ABS), and thermoplastic polyurethane (TPU). Reprinted from Ref. [151], licensed under a Creative Commons Attribution 4.0 International License.
    Fig. 11. (a) Exoskeleton with the flexible supports positioned on the shank region. (b) Schematic representation of the assembled flexible support using a PFGI-POF-FBG array, acrylonitrile butadiene styrene (ABS), and thermoplastic polyurethane (TPU). Reprinted from Ref. [151], licensed under a Creative Commons Attribution 4.0 International License.
    Schematic representation of PFGI-POF-FBG array embedded in cork insole for gait pattern measurements. Reprinted from Ref. [155], licensed under a Creative Commons Attribution 4.0 International License.
    Fig. 12. Schematic representation of PFGI-POF-FBG array embedded in cork insole for gait pattern measurements. Reprinted from Ref. [155], licensed under a Creative Commons Attribution 4.0 International License.
    Example of a textile bound FBG-POF sensor array. (a) The fiber embedment process, (b) the final geosynthetic strip, and (c) the OTDR trace showing the FBGs in the first 50 m of POF.
    Fig. 13. Example of a textile bound FBG-POF sensor array. (a) The fiber embedment process, (b) the final geosynthetic strip, and (c) the OTDR trace showing the FBGs in the first 50 m of POF.
    EffectsMeasurandsReferences
    Distributed backscatter coefficient dependenceStrain ε[40,7487]
    Humidity RH[88,89]
    Temperature T[79,90]
    Distributed attenuationHumidity RH[76,88,89]
    Radiation[91]
    Cracks/deformation[77,85,92]
    Quasi-distributed backscatter or loss (transducer or sensitized fiber section)Fiber bend (backscatter)[93]
    Bend radius/orientation (backscatter)[90]
    pH (attenuation)[94]
    Humidity (attenuation)[95]
    Optical runtime changeDistributed strain/temperature[75,77,96,97]
    Quasi-distributed/integral strain[76,77,80,84,98]
    Table 1. Summary of Measurable Effects, Measurands, and Respective References for Rayleigh Backscatter-Based Sensing in POFs
     Silica SMFCYTOPPMMATOPASPC [145]Zeonex [146]
    ε(pm/με)11.430.77 [147]
    T (pm/K)9.617.6−109–78−30.0−23.9
    RH (pm/%RH)37.6347.316.4
    P (nm/MPa)0.16 [148]1.5
    Table 2. Sensing Coefficients of FBGs Inscribed in Silica Single-Mode Fiber (SMF28), CYTOP-Based PFGI-POF, PMMA-POF, TOPAS-POF, PC-POF, and Zeonex POFa
    Yosuke Mizuno, Antreas Theodosiou, Kyriacos Kalli, Sascha Liehr, Heeyoung Lee, Kentaro Nakamura. Distributed polymer optical fiber sensors: a review and outlook[J]. Photonics Research, 2021, 9(9): 1719
    Download Citation