
Shuyi Li, Lifeng Cai, Dingshan Gao, Jianji Dong, Jin Hou, Chunyong Yang, Shaoping Chen, Xinliang Zhang. Compact and broadband multimode waveguide bend by shape-optimizing with transformation optics[J]. Photonics Research, 2020, 8(12): 1843
- Photonics Research
- Vol. 8, Issue 12, 1843 (2020)
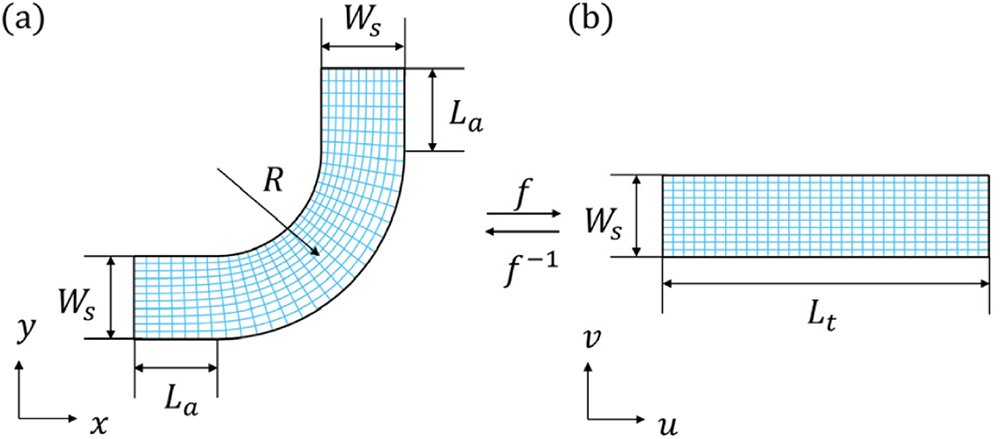
Fig. 1. CM from the arc-bend in the physical space to a rectangle in the virtual space. (a) The arc-bend is composed by two additional rectangles with length L a = 8 μm W s = 6 μm R = 9 μm L t W s = 6 μm L t u v L t ( u , v )
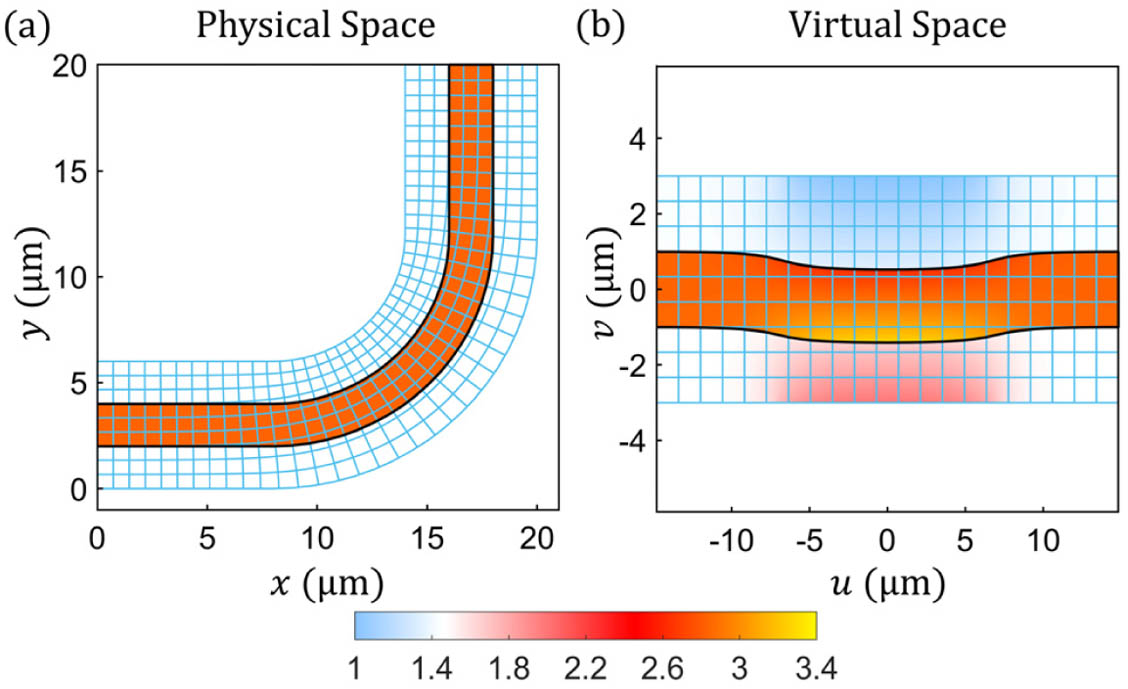
Fig. 2. (a) Index distribution of the waveguide arc-bend in physical space. The width of waveguide arc-bend is 2 μm, which can support four TE modes. The waveguide core index is 2.84, which is the TE 0 SiO 2 1 ) of CM. This original waveguide is not straight and has a gradient index distribution. These two negative factors cause the big loss and intermode cross talk of the traditional multimode waveguide arc-bend.
Fig. 3. (a) Index distribution of the shape optimized original waveguide in virtual space; (b) index distribution of the MWB in physical space. This MWB has a uniform core index, which makes fabrication easier.
Fig. 4. Multimode propagation performance of the shape-optimized original waveguide in virtual space. (a)–(d) The profiles of the H z TE 0 TE 1 TE 2 TE 3
Fig. 5. 3D FDTD simulation results of shape-optimized MWB in physical space. (a)–(d) The profiles of the H z TE 0 TE 1 TE 2 TE 3 H z
Fig. 6. Simulated transmission spectra of shape-optimized multimode bend waveguide. (a)–(d) The spectra for (a) TE 0 TE 1 TE 2 TE 3 TE 0 TE 1 TE 2 TE 3 − 24 dB − 20 dB
Fig. 7. Simulated transmission efficiencies of shape-optimized MWB at 1550 nm wavelength vary with the width fabrication deviation Δ w TE 0 TE 1 TE 2 − 20 dB ± 50 nm
Fig. 8. Microscopic view of the fabricated PICs and device. (a) The referenced PIC without MWB, including grating couplers, mode multiplexers, and demultiplexers; (b) PIC with MWB; (c) magnified microscopic view of the shape-optimized MWB.
Fig. 9. Measured transmission spectra of the shape-optimized MWB for (a) TE 0 TE 1 TE 2 TE 3 TE 0 TE 1 TE 2 TE 3 − 17 dB
|
Table 1. Comparison of Reported MWBs on Silicon Platform (Theoretical Performance)a

Set citation alerts for the article
Please enter your email address
© Copyright 2018-2021 | Chinese Laser Press. All Rights Reserved 沪ICP备15018463号-20