• Infrared and Laser Engineering
  • Vol. 51, Issue 6, 20220133 (2022)
Zhenshuai Wei1, Yongyao Xie2, Xianbin Shao2, Jundu Liu1, Wei Zhao2, Xian Zhao1, Xingyu Zhang1、2, Zhigang Zhao1、2, Zhenhua Cong1、2, and Zhaojun Liu1、2
Author Affiliations
  • 1Key Laboratory of Laser & Infrared System (Shandong University), Ministry of Education, Qingdao 266237, China
  • 2Shandong Provincial Key Laboratory of Laser Technology and Application, School of Information Science and Engineering,Shandong University, Qingdao 266237, China
  • show less
    DOI: 10.3788/IRLA20220133 Cite this Article
    Zhenshuai Wei, Yongyao Xie, Xianbin Shao, Jundu Liu, Wei Zhao, Xian Zhao, Xingyu Zhang, Zhigang Zhao, Zhenhua Cong, Zhaojun Liu. Research progress of single-frequency fiber laser based on Re: YAG-SiO2 fiber (Invited)[J]. Infrared and Laser Engineering, 2022, 51(6): 20220133 Copy Citation Text show less
    Schematic diagram of molten core method
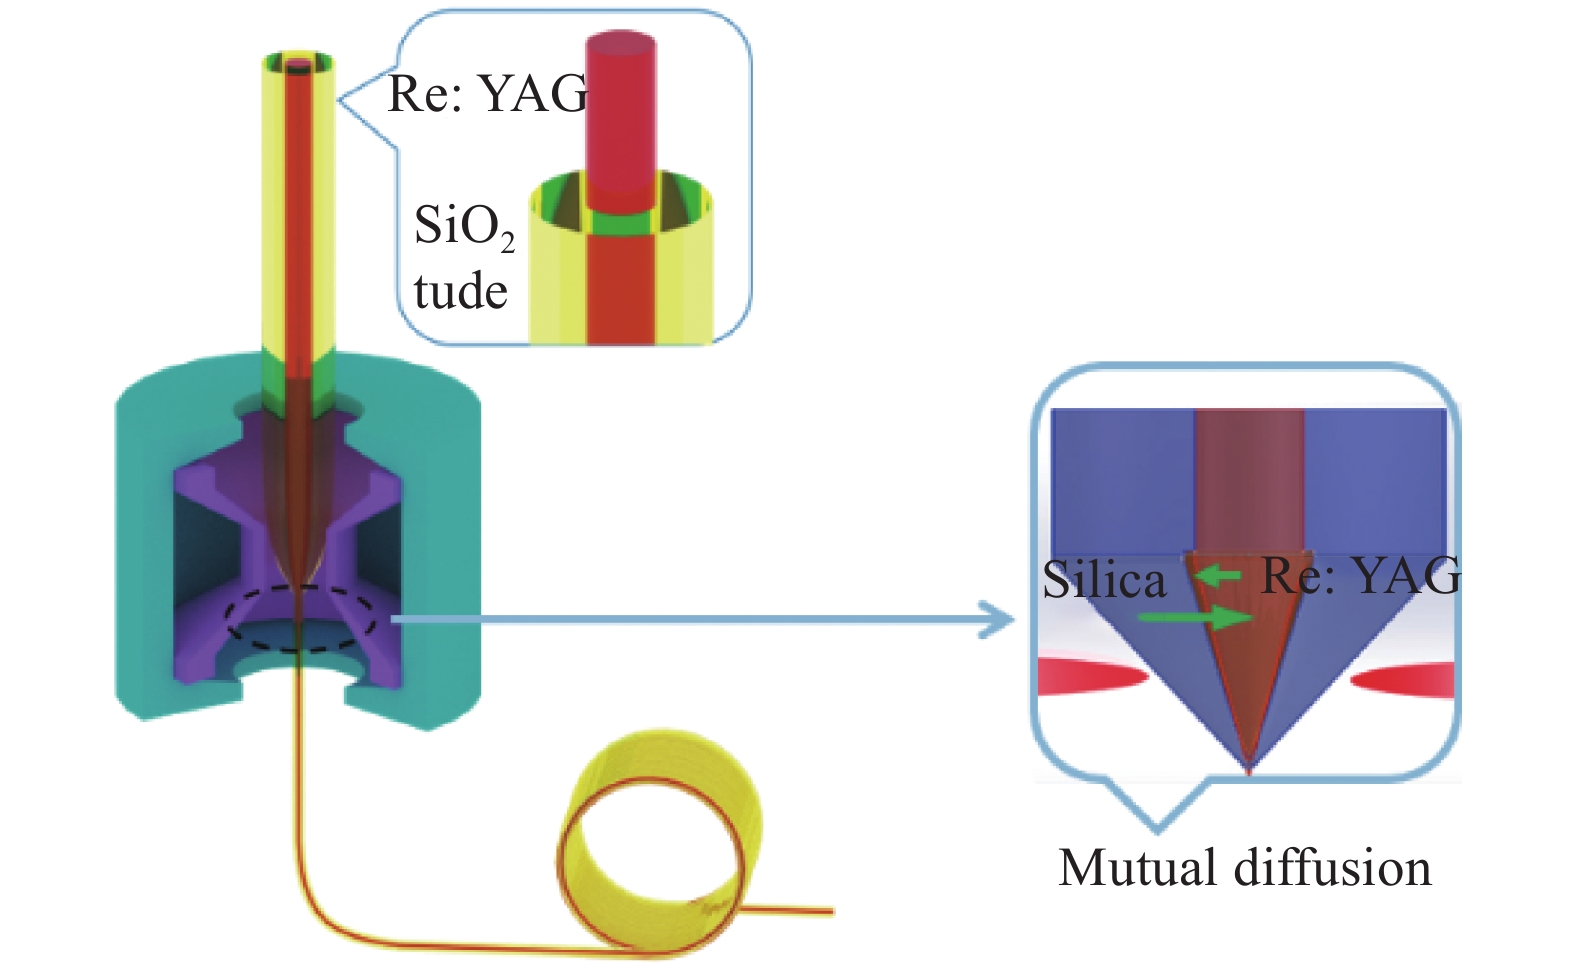
    Fig. 1. Schematic diagram of molten core method
    (a) Schematic diagram of twice drawing[39]; (b)-(g) Optical micrograph of the cross-section for YAG, Yb:YAG, Nd:YAG, Er:YAG, Er/Yb:YAG, Tm:YAG-SiO2 fiber
    Fig. 2. (a) Schematic diagram of twice drawing[39]; (b)-(g) Optical micrograph of the cross-section for YAG, Yb:YAG, Nd:YAG, Er:YAG, Er/Yb:YAG, Tm:YAG-SiO2 fiber
    Energy level structure of Nd3+
    Fig. 3. Energy level structure of Nd3+
    (a) Schematic diagram of single-frequency laser; (b) Longitudinal mode characteristics by F-P interferometer[47]
    Fig. 4. (a) Schematic diagram of single-frequency laser; (b) Longitudinal mode characteristics by F-P interferometer[47]
    (a) Schematic diagram of single-frequency laser; (b) Output power with respect to pump power; (c) Output spectrum[49]
    Fig. 5. (a) Schematic diagram of single-frequency laser; (b) Output power with respect to pump power; (c) Output spectrum[49]
    Energy level structure of Yb3+ [54]
    Fig. 6. Energy level structure of Yb3+ [54]
    (a) Schematic diagram of single-frequency laser; (b) Output power with respect to pump power; (c) Output spectrum[56]
    Fig. 7. (a) Schematic diagram of single-frequency laser; (b) Output power with respect to pump power; (c) Output spectrum[56]
    (a) Schematic diagram of experiment; (b) Internal structure; (c) Self-heterodyne signal with Lorentzian fitted linewidth; (d) Operation interface of Labview;(e) Prototype; (f) Output power stability[57]
    Fig. 8. (a) Schematic diagram of experiment; (b) Internal structure; (c) Self-heterodyne signal with Lorentzian fitted linewidth; (d) Operation interface of Labview;(e) Prototype; (f) Output power stability[57]
    (a) Schematic diagram of amplifier device; (b) Output power and backward optical power with respect to pump power; (c) Laser linewidth before and after amplification[58]
    Fig. 9. (a) Schematic diagram of amplifier device; (b) Output power and backward optical power with respect to pump power; (c) Laser linewidth before and after amplification[58]
    (a) Schematic diagram of single-frequency laser; (b) Output power with respect to pump power; (c) Self-heterodyne signal with Lorentzian fitted linewidth[60]
    Fig. 10. (a) Schematic diagram of single-frequency laser; (b) Output power with respect to pump power; (c) Self-heterodyne signal with Lorentzian fitted linewidth[60]
    (a) Molten core method based on CO2 laser-heated; (b) Output power with respect to pump power[62]
    Fig. 11. (a) Molten core method based on CO2 laser-heated; (b) Output power with respect to pump power[62]
    Energy level structure of Er3+[54]
    Fig. 12. Energy level structure of Er3+[54]
    (a) Schematic diagram of single-frequency laser; (b) Output power with respect to pump absorption power; (c) Longitudinal mode characteristics by F-P interferometer; (d) Typical trace of single pulse[39]
    Fig. 13. (a) Schematic diagram of single-frequency laser; (b) Output power with respect to pump absorption power; (c) Longitudinal mode characteristics by F-P interferometer; (d) Typical trace of single pulse[39]
    (a) Schematic of the co-melt in tube method; (b) Output spectrum; (c) Longitudinal mode characteristics by F-P interferometer[54]
    Fig. 14. (a) Schematic of the co-melt in tube method; (b) Output spectrum; (c) Longitudinal mode characteristics by F-P interferometer[54]
    Energy level structure of Tm3+
    Fig. 15. Energy level structure of Tm3+
    (a) Schematic diagram of single-frequency laser; (b) Output spectrum; (c) Longitudinal mode characteristics by F-P inter-ferometer; (d) Output power with respect to pump power and pump absorption power
    Fig. 16. (a) Schematic diagram of single-frequency laser; (b) Output spectrum; (c) Longitudinal mode characteristics by F-P inter-ferometer; (d) Output power with respect to pump power and pump absorption power
    Core precursor Gain /dB·cm-1Gain fiber length /cm Power /mW Slope efficiency Refs
    Nd:YAG ceramic (5.0-at.%) 1.57@ 1064 nm 1.8-6%[47]
    Nd:YAG crystal (2.5-at.%) 1.49@ 1064 nm 0.92.581.26%[48]
    Nd:YAG crystal (2.5-at.%) 1.16@ 915 nm 0.60.10.11%[50]
    Table 1. Research progress of single-frequency fiber laser based on Nd:YAG-SiO2 fiber
    Gain fiberWavelength/ nm Output power/ mW Slope efficiency OSNR/ dB RMSLinewidth/ kHz Refs
    Core precursor Doping/ wt.% Gain/ dB·cm−1Transmission loss/ dB·cm−1NA
    Yb:YAG ceramic 2.63@ 1064 nm 0.03@ 1550 nm 0.471064-3.8%---[55]
    Yb:YAG Crystal 4.81.7@ 1064 nm 0.005@ 1550 nm 0.42106411018.5%800.51%@ 1 h 93[56]
    Yb:YAG crystal -2.7@ 1064 nm --1064105.6 MOPA 17.1% Seed 630.096%@ 48 h 3[57]
    Yb:YAG crystal 4.21.7@ 1064 nm 0.005@ 1550 nm 0.42106660.6 Linear polariza-tion 16.6%80<2.2%@ 6 h 81[58]
    Yb:YAG crystal 4.81.7@ 1064 nm 0.005@ 1550 nm 0.421064136 Pulse peak ->60--[54]
    Yb:YAG crystal 4.81.7@ 1064 nm 0.005@ 1550 nm 0.4210704510.2%600.36%@ 0.5 h <4.3[59]
    Yb:YAG crystal 5.2512.6@ 976 nm 0.06@ 1550 nm 0.5097617.812.1%>45-<41[60]
    Yb:YAG crystal 5.664.4@ 1030 nm -0.42103025834.9%79<0.85% @ 13 h 171[61]
    Yb:YAG crystal 6.576.0@ 1030 nm 0.006@ 1550 nm -1030103.518.3%>630.65%@ 10 h <7.5[62]
    Yb:YAG powder 4.53-0.054@ 1550 nm 0.261062~4215.3%600.68% @ 1 h 230[63]
    Table 2. Research progress of single-frequency fiber laser based on Yb:YAG-SiO2 fiber
    Core precursorDoping/wt.%Gain/dB·cm-1Power/mWSlope efficiencyRefs
    Er:YAG ceramicEr2O3: 2.96 1.46 @ 1550 nm24.215.1%[39]
    Er:YAG crystal + Yb:YAG crystalEr2O3: 2.51 Yb2O3:2.38 2.33@ 1550 nm--[54]
    Table 3. Research progress of single-frequency fiber laser based on Re:YAG-SiO2 fiber in 1.5 μm band
    Zhenshuai Wei, Yongyao Xie, Xianbin Shao, Jundu Liu, Wei Zhao, Xian Zhao, Xingyu Zhang, Zhigang Zhao, Zhenhua Cong, Zhaojun Liu. Research progress of single-frequency fiber laser based on Re: YAG-SiO2 fiber (Invited)[J]. Infrared and Laser Engineering, 2022, 51(6): 20220133
    Download Citation