• Chinese Optics Letters
  • Vol. 21, Issue 6, 061101 (2023)
Chenyang Yue1、2、3, Hong Jiang1, Tianzhi Li1、4, Siyan Yao1、2, Shengyue Zeng1, Xiaojun Xu1、2、3, and Chaofan Zhang1、4、*
Author Affiliations
  • 1College of Advanced Interdisciplinary Studies, National University of Defense Technology, Changsha 410073, China
  • 2State Key Laboratory of Pulsed Power Laser Technology, Changsha 410073, China
  • 3Hunan Provincial Key Laboratory of High Energy Laser Technology, Changsha 410073, China
  • 4Nanhu Laser Laboratory, National University of Defense Technology, Changsha 410073, China
  • show less
    DOI: 10.3788/COL202321.061101 Cite this Article Set citation alerts
    Chenyang Yue, Hong Jiang, Tianzhi Li, Siyan Yao, Shengyue Zeng, Xiaojun Xu, Chaofan Zhang. Compact in situ microscope for photoelectron spectroscopy via two-mirror reflection[J]. Chinese Optics Letters, 2023, 21(6): 061101 Copy Citation Text show less
    Principle and scheme of the side-assisting microscope. (a) Principal optical setup including three parts: (1) LED collimation stage; (2) ultrahigh vacuum chamber; (3) microscopic imaging. (b) Photo of the experimental setup in a clean laboratory air environment.
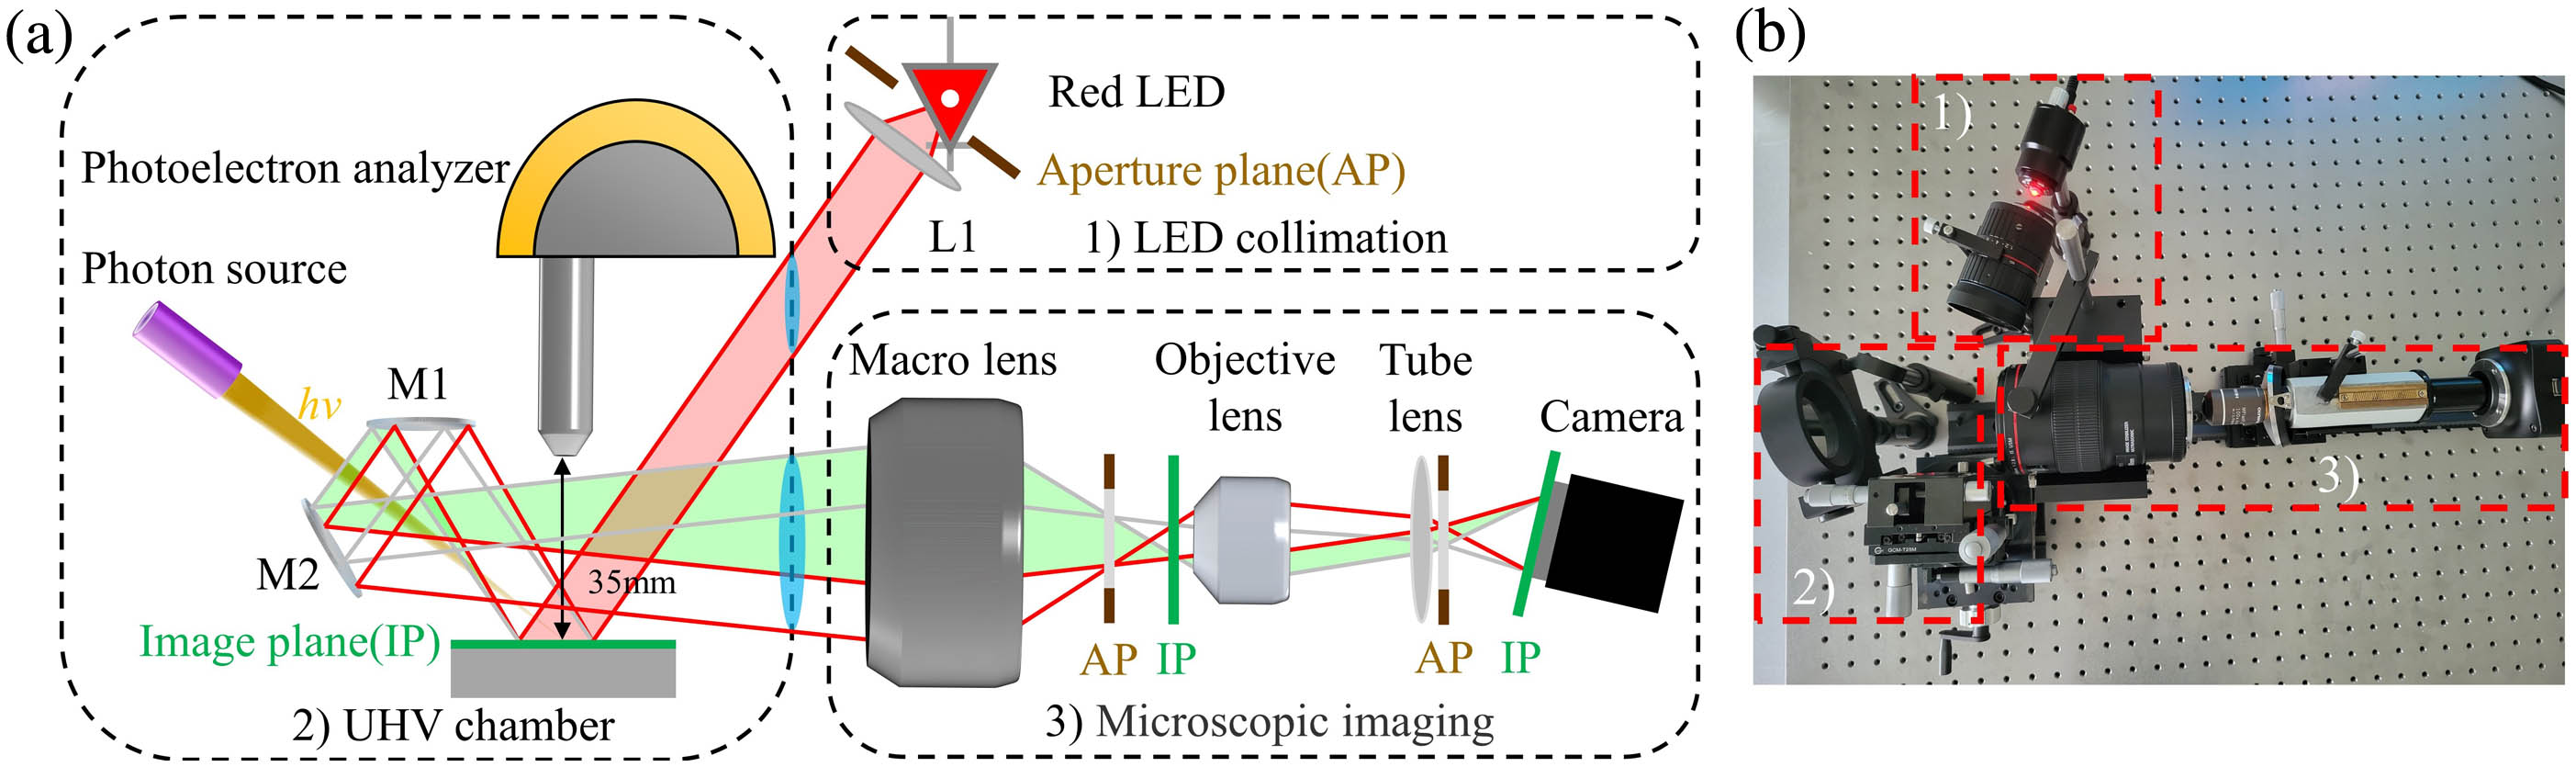
    Fig. 1. Principle and scheme of the side-assisting microscope. (a) Principal optical setup including three parts: (1) LED collimation stage; (2) ultrahigh vacuum chamber; (3) microscopic imaging. (b) Photo of the experimental setup in a clean laboratory air environment.
    System spatial resolution testing. (a) Image of a USAF target (groups 6 and 7); (b) region for experimenting; (c) and (d) assessed resolution of the side-assisting microscope system along the solid line (X and Y) of (b), respectively.
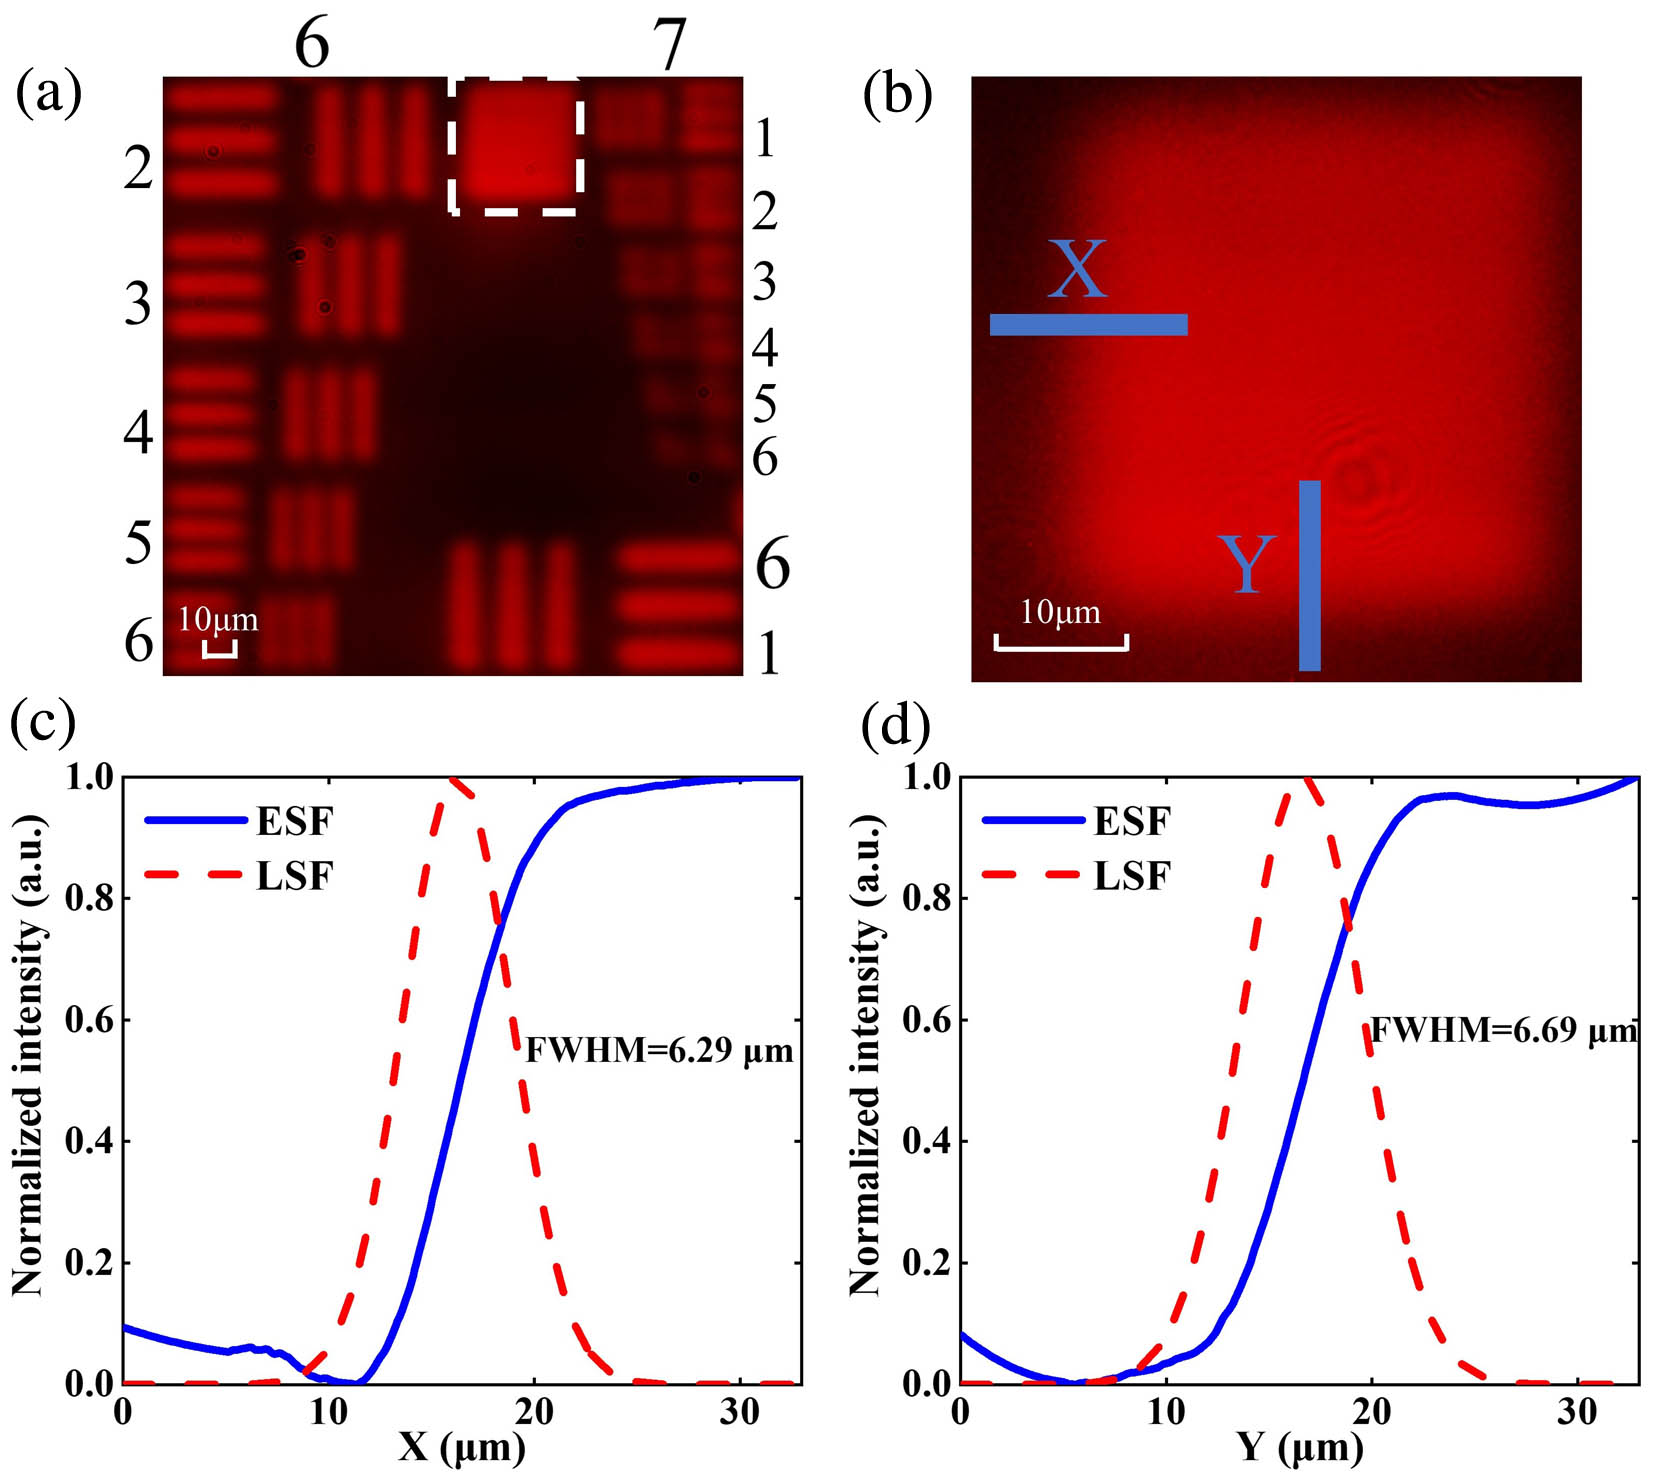
    Fig. 2. System spatial resolution testing. (a) Image of a USAF target (groups 6 and 7); (b) region for experimenting; (c) and (d) assessed resolution of the side-assisting microscope system along the solid line (X and Y) of (b), respectively.
    System field curvature testing. (a) Two-dimensional image of a 20 µm-period grating with a vertical orientation. The inset in (a) shows a microscopic image of the grating. (b) The intensity profile (blue line) extracted along the white solid line in (a) and the first derivative of the line cut (red line); (c) FWHM corresponding to the peaks (black line) and troughs (red line) of the first derivatives of the intensity in (b).
    Fig. 3. System field curvature testing. (a) Two-dimensional image of a 20 µm-period grating with a vertical orientation. The inset in (a) shows a microscopic image of the grating. (b) The intensity profile (blue line) extracted along the white solid line in (a) and the first derivative of the line cut (red line); (c) FWHM corresponding to the peaks (black line) and troughs (red line) of the first derivatives of the intensity in (b).
    System distortion testing. (a) Standard grid pattern of 100 µm; (b) experimental result of standard grid pattern; (c) intensity profiles of standard grid (black lines) and experimental result (red lines) plotted via the horizontal yellow solid lines in (a) and (b); (d) intensity profiles of standard grid and experimental result plotted via the vertical yellow solid lines in (a) and (b); insets in (c) and (d) show the distortion of X direction and Y direction, respectively.
    Fig. 4. System distortion testing. (a) Standard grid pattern of 100 µm; (b) experimental result of standard grid pattern; (c) intensity profiles of standard grid (black lines) and experimental result (red lines) plotted via the horizontal yellow solid lines in (a) and (b); (d) intensity profiles of standard grid and experimental result plotted via the vertical yellow solid lines in (a) and (b); insets in (c) and (d) show the distortion of X direction and Y direction, respectively.
    Experimental results and quantitative analysis. (a) Sample morphology and region for experimenting; (b) result of square-shaped area; (c) and (d) resolution measured along the two line cuts in (b), respectively; (e) result of central stripe area with our setup; (f) result of conventional high-resolution optical microscope at 40×.
    Fig. 5. Experimental results and quantitative analysis. (a) Sample morphology and region for experimenting; (b) result of square-shaped area; (c) and (d) resolution measured along the two line cuts in (b), respectively; (e) result of central stripe area with our setup; (f) result of conventional high-resolution optical microscope at 40×.
    Microscope images of graphene flake. (a) Conventional optical microscope image of the sample at 25×; (b) microscope image with the proposed setup.
    Fig. 6. Microscope images of graphene flake. (a) Conventional optical microscope image of the sample at 25×; (b) microscope image with the proposed setup.
    Chenyang Yue, Hong Jiang, Tianzhi Li, Siyan Yao, Shengyue Zeng, Xiaojun Xu, Chaofan Zhang. Compact in situ microscope for photoelectron spectroscopy via two-mirror reflection[J]. Chinese Optics Letters, 2023, 21(6): 061101
    Download Citation