• Laser & Optoelectronics Progress
  • Vol. 56, Issue 15, 151501 (2019)
Ying Luo1, Guanying Huo1、2、*, Jinxin Xu1, and Qingwu Li1、2
Author Affiliations
  • 1 College of Internet of Things Engineering, Hohai University, Changzhou, Jiangsu 213022, China
  • 2 Changzhou Key Laboratory of Sensor Networks and Environmental Sensing, Changzhou, Jiangsu 213022, China
  • show less
    DOI: 10.3788/LOP56.151501 Cite this Article Set citation alerts
    Ying Luo, Guanying Huo, Jinxin Xu, Qingwu Li. Non-Local Stereo Matching Algorithm Based on Edge Constraint Iteration[J]. Laser & Optoelectronics Progress, 2019, 56(15): 151501 Copy Citation Text show less
    Flow chart of proposed algorithm
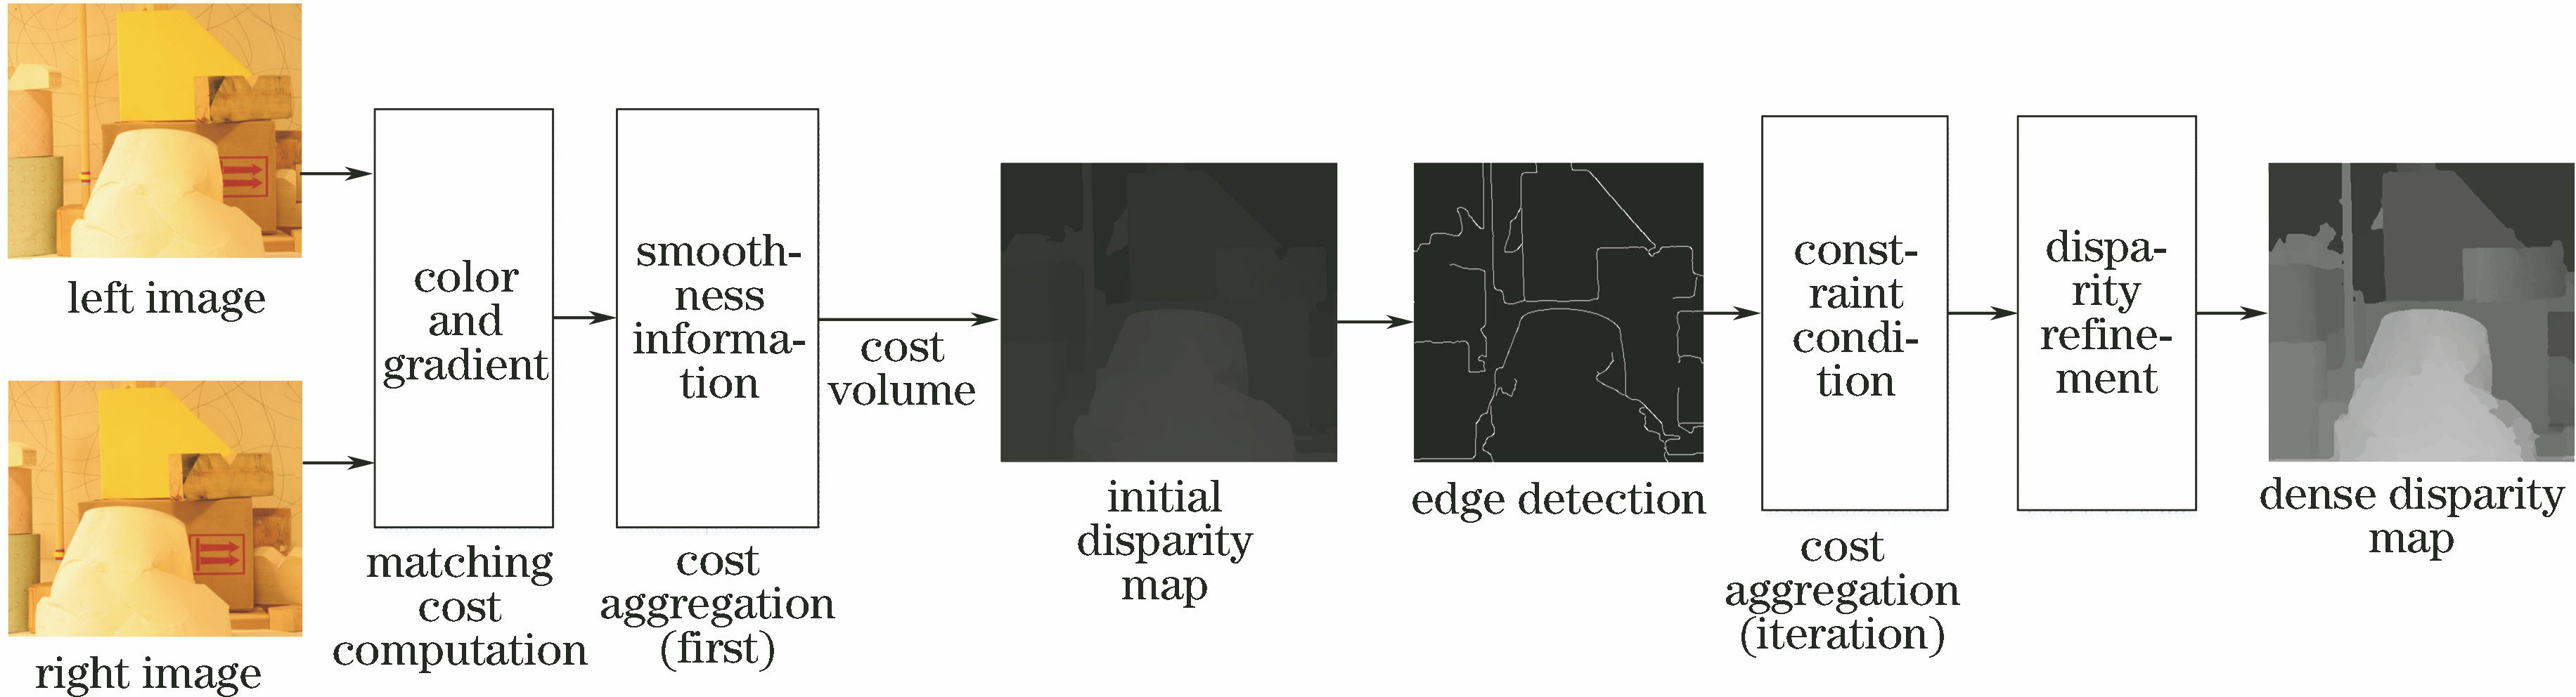
    Fig. 1. Flow chart of proposed algorithm
    First cost aggregation based on minimum spanning tree. (a) Cost aggregation from bottom to up; (b) cost aggregation from up to bottom
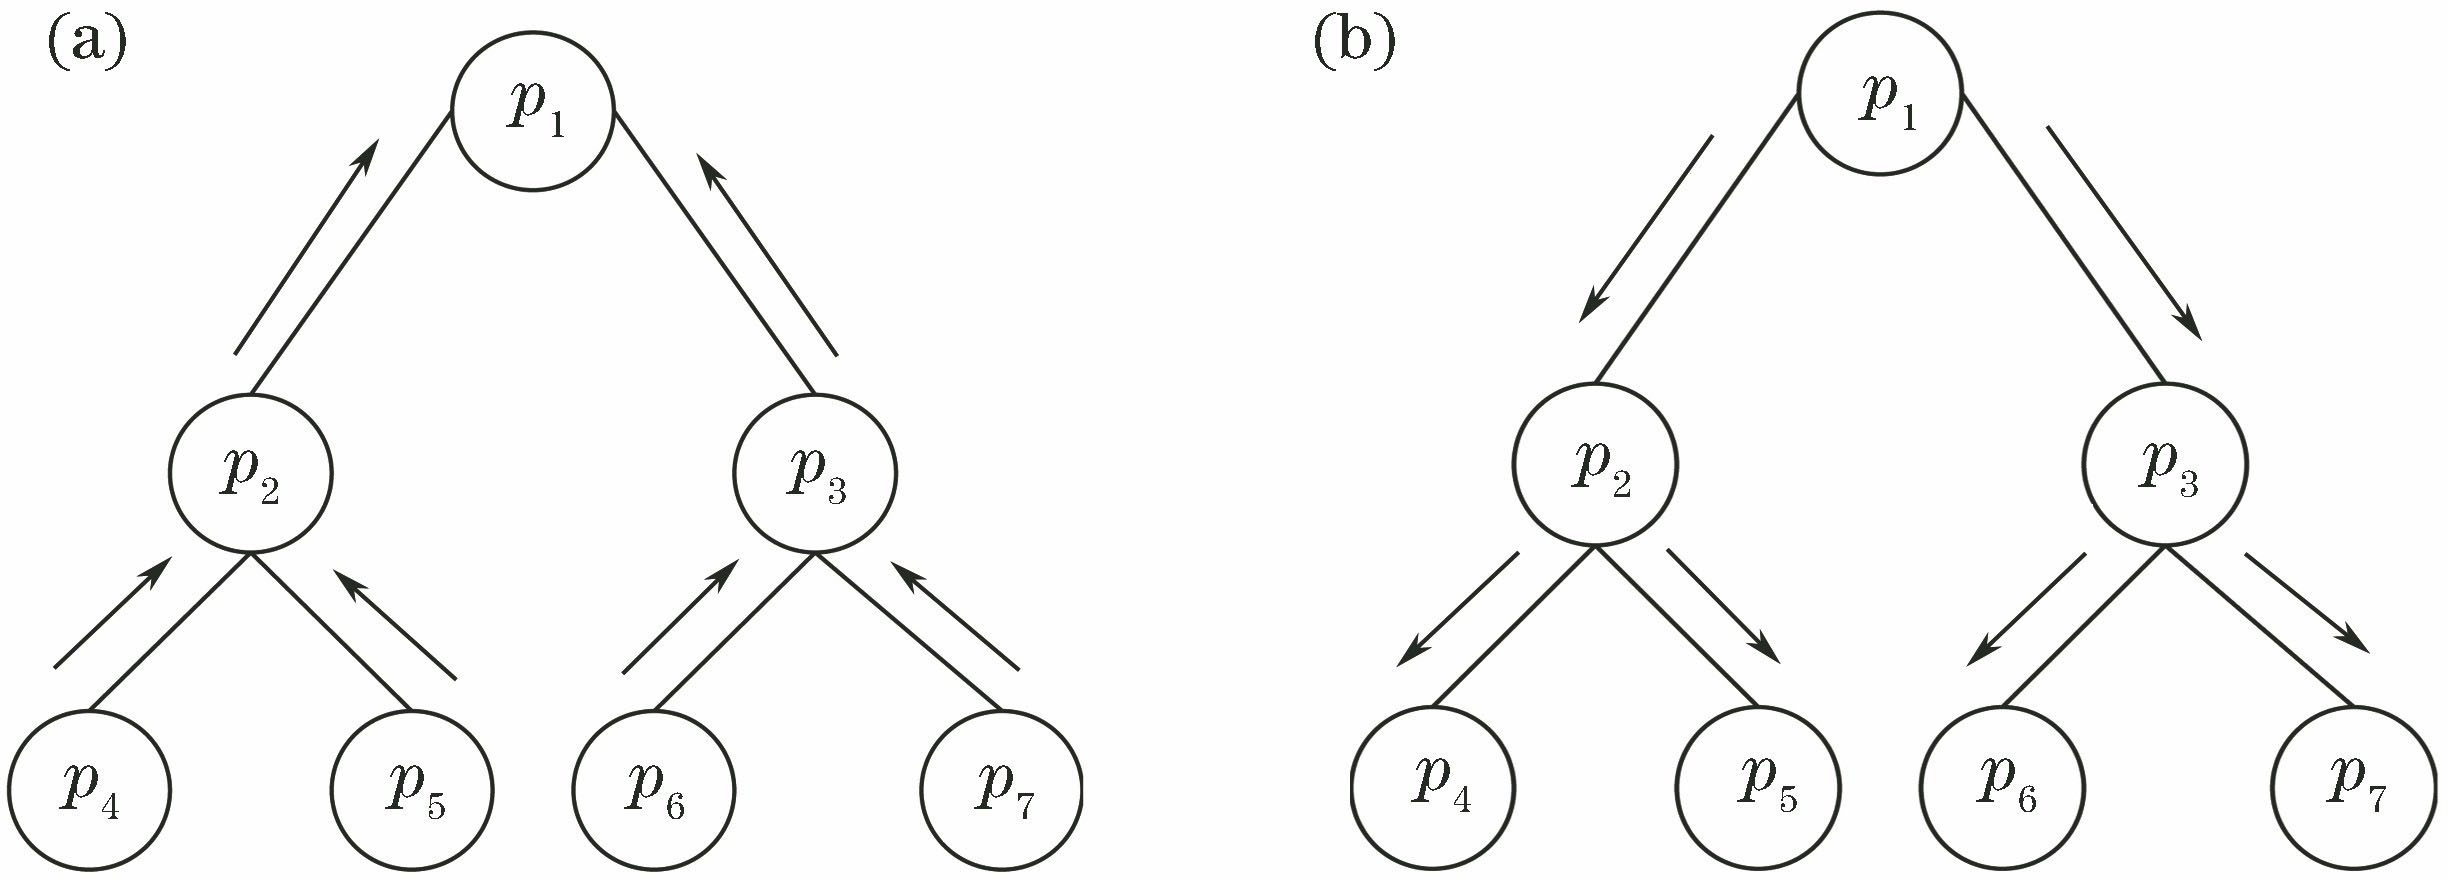
    Fig. 2. First cost aggregation based on minimum spanning tree. (a) Cost aggregation from bottom to up; (b) cost aggregation from up to bottom
    Constraint-based second cost aggregation. (a) Cost aggregation from bottom to up; (b) cost aggregation from up to bottom
    Fig. 3. Constraint-based second cost aggregation. (a) Cost aggregation from bottom to up; (b) cost aggregation from up to bottom
    Comparison of disparity maps of two aggregation algorithms. (a) Reference images; (b) disparity maps obtained by original aggregation algorithm; (c) disparity maps obtained by proposed aggregation algorithm
    Fig. 4. Comparison of disparity maps of two aggregation algorithms. (a) Reference images; (b) disparity maps obtained by original aggregation algorithm; (c) disparity maps obtained by proposed aggregation algorithm
    Experimental results corresponding to parameter Π setting. (a) Mismatching rate of images of group 1 under different parameters; (b) mismatching rate of images of group 2 under different parameters
    Fig. 5. Experimental results corresponding to parameter Π setting. (a) Mismatching rate of images of group 1 under different parameters; (b) mismatching rate of images of group 2 under different parameters
    Experimental results of Middlebury test dataset (rich texture region). (a) Left of images to be tested; (b) real disparity maps; (c) disparity maps obtained by proposed algorithm
    Fig. 6. Experimental results of Middlebury test dataset (rich texture region). (a) Left of images to be tested; (b) real disparity maps; (c) disparity maps obtained by proposed algorithm
    Experimental results of Middlebury test dataset (low-texture region). (a)Reference images; (b) real disparity maps; (c) disparity maps obtained by proposed algorithm
    Fig. 7. Experimental results of Middlebury test dataset (low-texture region). (a)Reference images; (b) real disparity maps; (c) disparity maps obtained by proposed algorithm
    Disparity maps obtained by six algorithms. (a) MST; (b) ST-2; (c) CSMST; (d) WCPSP; (e) MST-CD2; (f) proposed algorithm
    Fig. 8. Disparity maps obtained by six algorithms. (a) MST; (b) ST-2; (c) CSMST; (d) WCPSP; (e) MST-CD2; (f) proposed algorithm
    StereopairsRMismatching rate /%
    MSTST-2CS-MSTWCPSPMST-CD2Proposed algorithm
    Tsukuba0.05261.4931.5341.7753.0161.3411.432
    Venus0.05210.2530.3641.2460.8650.2120.171
    Teddy0.0386.0146.5865.7323.7415.9236.185
    Cones0.0262.8722.8834.4263.9953.2242.801
    Aloe0.01935.0254.4244.8864.0824.1933.771
    Art0.034610.2459.98410.6968.3829.0437.841
    Baby10.013110.5064.2028.2143.3418.4954.963
    Baby20.033217.96615.96513.5433.25115.28410.542
    Baby30.04057.3465.1625.5932.6015.9846.405
    Books0.033610.09510.03410.6666.4319.6738.882
    Bowling10.027422.56621.72519.56311.37118.49221.354
    Bowling20.033611.60611.04510.1145.8619.6236.302
    Cloth10.01030.5440.5130.6350.6960.4520.341
    Cloth20.02624.1953.5944.3562.4413.0132.512
    Cloth30.03862.1651.6312.9061.6421.6631.714
    Cloth40.02131.5041.2931.8861.6751.1020.871
    Dolls0.04616.1665.1045.8954.0714.9225.063
    Flowerpots0.032522.26615.42316.79413.55118.52514.902
    Lampshade10.008112.81611.71510.10210.33310.4448.861
    Lampshade20.007712.29513.30612.0847.26110.7539.202
    Laundry0.030811.42311.93511.92412.07610.94111.222
    Midd10.042923.15521.23224.43428.83622.49320.361
    Midd20.039932.76620.41120.57235.14530.87424.263
    Moebius0.02597.8757.6447.57310.5367.3817.532
    Monopoly0.014920.25419.03121.03528.16619.45319.122
    Plastic0.033646.69638.77245.02443.25345.88534.781
    Reindeer0.0449.6757.1229.7966.1218.8047.373
    Rocks10.02812.7652.3543.3561.7922.2531.621
    Rocks20.02842.0351.6642.2861.3511.6031.422
    Wood10.010111.9264.87210.1842.85110.3056.523
    Wood20.01881.1042.8253.1760.7820.8930.731
    Average error /%10.8969.17310.0158.6929.7848.351
    Average rank4.7163.6844.6852.9723.2632.121
    Average time /s0.7811.1724.1363.5452.1641.743
    Table 1. Mismatching rates of six methods in 31 groups of images
    Ying Luo, Guanying Huo, Jinxin Xu, Qingwu Li. Non-Local Stereo Matching Algorithm Based on Edge Constraint Iteration[J]. Laser & Optoelectronics Progress, 2019, 56(15): 151501
    Download Citation