Author Affiliations
1College of Advanced Interdisciplinary Studies, National University of Defense Technology, Changsha, Hunan 410073, China2State Key Laboratory of Pulsed Power Laser Technology, Changsha, Hunan 410073, China3Hunan Provincial Key Laboratory of High Energy Laser Technology, Changsha, Hunan 410073, Chinashow less
Fig. 1. Typical fiber loss profiles in long-wavelength side for common fiber materials
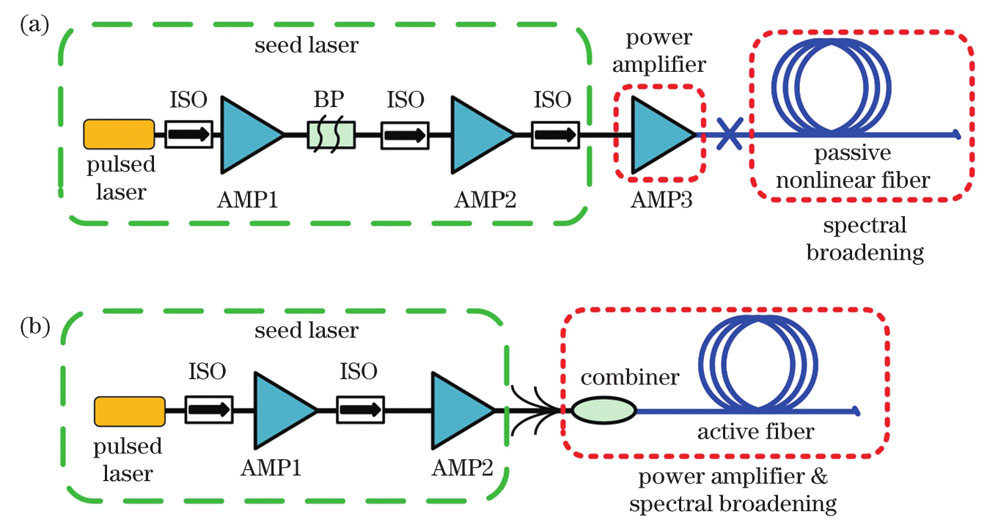
[42] Fig. 2. Technical schemes of high power MIR-SC fiber lasers. (a) Based on passive nonlinear fiber; (b) based on fiber amplifier
Fig. 3. SC laser spectrum at output power of 10.5 W
[58] Fig. 4. SC laser spectra obtained by directly pumping ZBLAN fiber with 2 μm pulsed fiber laser
[70] Fig. 5. Spectra of SC laser with output power of 13 W
[59] Fig. 6. Spectra of SC laser with output power of 21.8 W
[60] Fig. 7. All-fiber SC laser
[75]. (a) Schematic of experimental setup; (b) microscope photo of fusion splicing joint; photos of end surfaces of (c) silica and (d) ZBLAN fibers after pulling apart
Fig. 8. Experimental layout of spectrally-flat MIR-SC laser
[73] Fig. 9. Output spectrum of spectrally-flat MIR-SC laser
[73] Fig. 10. SC laser spectra for different output powers
[62] Fig. 11. MIR-SC laser with average power of 30 W
[57]. (a) Structural diagram; (b) spectra
Fig. 12. MIR-SC laser spectra for average power of 20.6 W
[76] Fig. 13. Er
3+∶ZBLAN fiber amplifier
[64]. (a) Layout of experimental setup; (b) spectral characteristics of SC laser
Fig. 14. Output spectra for different Er
3+∶ZBLAN fiber lengths
[65] Fig. 15. Ho
3+∶ZBLAN fiber amplifier
[66]. (a) Layout of experimental setup; (b) SC spectra
Fig. 16. Output spectra of MIR-SC laser based on EDZFA
[67] Fig. 17. Er
3+∶ZBLAN all-fiber amplifier
[87]. (a) Layout of experimental setup; (b) SC spectral evolution
Fig. 18. 0.75-5.1 μm SC laser
[95]. (a) Layout of experimental setup; (b) SC spectra
Fig. 19. Experiment of watt level SC laser based on InF
3 fiber
[88]. (a) Experimental setup; (b) SC laser spectra
Fig. 20. Spectra of SC laser based on InF
3 fiber for different pump powers
[96] Fig. 21. Spectra of 10 W level MIR SC laser pumped by 1960 nm picosecond laser
[98] Fig. 22. MIR-SC laser spectra for average power of 11.8 W
[82] Fig. 23. Spectra of 19.6 W MIR-SC laser based on tellurite fiber
[99] Fig. 24. Spectra of watt-level SC laser based on As
2S
3 fiber
[56] | Condition | Sub-picosecond pulse | Picosecond and longer pulse |
|---|
| Normal group velocity dispersion | Self-phase modulation, four wave mixing, and Raman scattering | Four wave mixing, Raman scattering, and self-phase modulation | | Anomalous group velocity dispersion | Soliton fission, Raman induced SFSS, and dispersive wave generation | Modulation instability, Raman induced SFSS, and dispersive wave generation |
|
Table 1. Dominant nonlinear effects under different dispersion regimes and different pump pulse durations
[36] | Characteristic | Parameter | Silica | Tellurite | Fluoride | Chalcogenide |
|---|
| AlF3 | ZBLAN | InF3 | As2S3 | As2Se3 |
|---|
| Dispersion characteristic | Material refractive index | 1.45 | ~2 | 1.46 | 1.48-1.53 | 1.47-1.53 | 2.415 | 2.83 | | Typical bulk ZDW /μm | 1.26 | 2.13 | - | 1.71 | ~1.8 | 4.81 | 7.5 | | Loss characteristic | Phonon energy /cm-1 | 1100 | 800 | - | 550 | - | 350 | - | | Bulk transmission window /μm | 0.2-3.5 | 0.4-5.0 | - | 0.3-7.5 | 0.3-9.5 | 0.8-7.0 | 1-15 | | Fiber transmission window /μm | 0.4-2.5 | - | 0.3-3.5 | 0.5-4.5 | 0.5-5.5 | 1.0-6.0 | 1.5-10.0 | | Nonlinear characteristic | Raman frequency shift /THz | 13.2 | 21 | - | ~17.7 | - | 10.2 | ~7.2 | | Self-focus threshold at 2 μm /MW | 15.1 | 0.57 | - | 12 | 12 | 0.08 | 0.03 | | Nonlinear refractive index /(10-20 m2·W-1) | 2.6 | 19 | - | 3.3 | - | 300 | 1500 | | Thermal characteristic | Transition temperature /℃ | 1000 | 300 | 367 | 260 | 300 | 185 | 178 | | Thermal conductivity /(W·m-1·K-1) | 1.38 | 1.25 | - | 0.628 | - | 0.2 | - | | Thermal expansion coefficient /(10-6 K-1) | 0.55 | 12-17 | 18.6 | 17.2 | - | 14 | - |
|
Table 2. Typical physical and chemical parameters of common optical fibers
[54] | Year | Central wavelength of seed laser | Pulse duration | Pulse repetition rate | Amplifier type | Output power of fiber amplifier | Coupling method | Coupling efficiency | SC characteristic | Ref. |
|---|
| Spectral range /μm | Power /W | Conversion efficiency /% |
|---|
| 2009 | 1550 nm | 400 ps | 3.33 MHz | EYDFA | 20.2 W | Mechanical splice | >60% | 0.8-4.0 | 10.5 | 52.0 | [58] | | 2013 | 1960 nm | 26.7 ps | 29.4 MHz | LMA-TDFA | 31.5 W | Mechanical splice | 90% @1.15 W, 66% @31.5 W | 1.9-4.3 | 13 | 41.3 | [59] | | 2014 | 2.0-2.5 μm | | | SM-TDFA | | Mechanical splice | 80% | 1.9-3.5 | 16.2 | - | [74] | | 2014 | 1963 nm | 24 ps | 93.6 MHz | SM-TDFA | 42 W | Mechanical splice | 70%-80% | 1.9-3.8 | 21.8 | 51.9 | [60] | | 2016 | 1950 nm | 12.6 ps | 75.4 MHz | LMA-TDFA | 16.3 W | Fusion splice | 80.2% | 1.9-4.1 | 10.67 | 65.3 | [61] | | 2017 | 2.0-2.7 μm | 1 ns | 6 MHz | LMA-TDFA | 30.1 W | Fusion splice | | 1.9-4.25 | 15.2 | 50.5 | [62] | | 2019 | 1.9-2.6 μm | 3 ns | 3 MHz | SM-TDFA | 41.9 W | Fusion splice | 94.4% @2000 nm | 1.9-3.35 | 30.0 | 73.1 | [57] | | 2020 | 2.0-2.6 μm | 1 ns | 3 MHz | SM-TDFA | 37.9 W | Fusion splice | 94.2% @2000 nm | 1.92-4.29 | 20.6 | 54.3 | [57] |
|
Table 3. Parameters of SC lasers with output power >10 W based on undoped fluoride fibers
| Year | Seed laser pulse duration | Pulse repetition rate | Amplifier type | Pump wavelength | Output power of fiber amplifier | Core diameter /μm | Coupling method | SC characteristic | Ref. |
|---|
| 20 dB spectral range /μm | Power /W | Conversion efficiency /% |
|---|
| 2013 | 70 fs | | OPA | 3.4 μm | | 16 | Lens coupling | 2.7-4.7 | 0.0001 | - | [89] | | 2016 | 400 ps | 2 kHz | EDZFA | 2.7-3.1 μm | 21.8 mW | 13.5 | Lens coupling/fusion splice | 2.5-5.3 | 0.008 | 37.4 | [93] | | 2016 | 70 ps | 1 kHz | OPG | 2.02 μm | | 9 | Lens coupling | 1.9-5.3 | 0.008 | - | [40] | | 2018 | 400 ps | 20 kHz | EDZFA | | | 10 | Lens coupling/fusion splice | 2.75-5.40 | 0.145 | - | [65] | | 2015 | 100 fs | 50 MHz | TDFA | 1.9-2.2 μm | 570 mW | 7 | Lens coupling | 1.25-4.20 | 0.25 | 43.9 | [91] | | 2018 | 50 ps | 1 MHz | TDFA | 1.9-2.7 μm | 2.3 W | 9.5 | Mechanical splice | 1.7-4.9 | 1.0 | 43.5 | [94] | | 2018 | 1 ns | 100 kHz | TDFA | 2.0-2.7 μm | 2.27 W | 7.5 | Fusion splice | 1.60-5.07 | 1.35 | 59.5 | [88] | | 1 ns | 1 MHz | TDFA | 2.0-2.7 μm | 6.41 W | 2.0-4.8 | 4.06 | 63.3 | | 2018 | 35 ps | 1 MHz | TDFA | 1950 nm | 6.36 W | 9 | Lens coupling | 0.75-4.9 | 1.76 | 27.7 | [95] | | 2019 | 400 ps | 200 kHz | TDFA | 1960 nm | 4.9 W | 7.5 | Lens coupling | 1.90-4.65 | 3 | 60 | [96] | | 2020 | 90 ns | 60 kHz | TDFA | 2 μm | 15 W | 7.5 | Lens coupling | 2.0-3.9 | 7 | 46.7 | [97] | | 2019 | 60 ps | 33 MHz | TDFA | 2 μm | 17 W | 7.5 | Fusion splice | 1.85-4.53 | 11.3 | 66.5 | [98] | | 2020 | 1 ns | 1.5 MHz | TDFA | 2.0-2.7 μm | 18.3 W | 7.5 | Fusion splice | 1.96-4.77 | 11.8 | 64.5 | [82] |
|
Table 4. Parameters of SC lasers based on undoped InF3 fibers

![Typical fiber loss profiles in long-wavelength side for common fiber materials[42]](/richHtml/zgjg/2022/49/1/0101001/img_1.jpg)