• Laser & Optoelectronics Progress
  • Vol. 58, Issue 22, 2211001 (2021)
Haifei Zeng1、2、3, Changpei Han1、2、*, Kai Li1、2、3, and Huangwei Tu1、2、3
Author Affiliations
  • 1Shanghai Institute of Technical Physics, Chinese Academy of Sciences, Shanghai 200083, China
  • 2Key Laboratory of Infrared Detection and Imaging Technology, Shanghai Institute of Technical Physics, Chinese Academy of Sciences, Shanghai 200083, China
  • 3University of Chinese Academy of Sciences, Beijing 100049, China
  • show less
    DOI: 10.3788/LOP202158.2211001 Cite this Article Set citation alerts
    Haifei Zeng, Changpei Han, Kai Li, Huangwei Tu. Improved Gradient Threshold Image Sharpness Evaluation Algorithm[J]. Laser & Optoelectronics Progress, 2021, 58(22): 2211001 Copy Citation Text show less
    Sample image 1. (a) 1st frame image; (b) focusing image; (c) 25th frame image
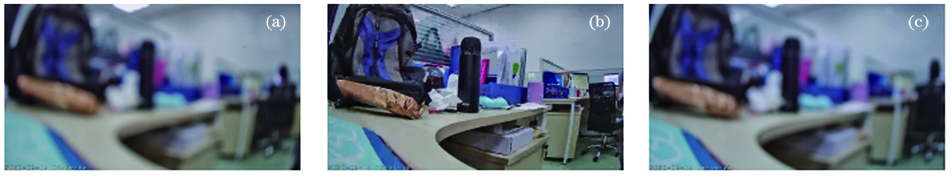
    Fig. 1. Sample image 1. (a) 1st frame image; (b) focusing image; (c) 25th frame image
    Sample image 2. (a) 1st frame image; (b) focusing image; (c) 17th frame image
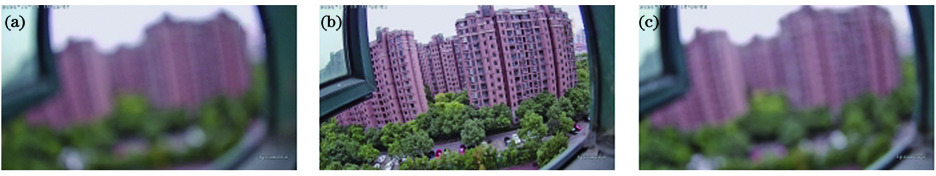
    Fig. 2. Sample image 2. (a) 1st frame image; (b) focusing image; (c) 17th frame image
    Sample image 3. (a) 1st frame image; (b) focusing image; (c) 24th frame image
    Fig. 3. Sample image 3. (a) 1st frame image; (b) focusing image; (c) 24th frame image
    Normalized sharpness evaluation curves of different images. (a) Sample image 1; (b) sample image 2; (c) sample image 3
    Fig. 4. Normalized sharpness evaluation curves of different images. (a) Sample image 1; (b) sample image 2; (c) sample image 3
    Normalized sharpness evaluation curves of different noised images. (a) Sample image 1 after adding Gaussian noise; (b) sample image 1 after adding salt and pepper noise; (c) sample image 2 after adding Gaussian noise; (d) sample image 2 after adding salt and pepper noise; (e) sample image 3 after adding Gaussian noise; (f) sample image 3 after adding salt and pepper noise
    Fig. 5. Normalized sharpness evaluation curves of different noised images. (a) Sample image 1 after adding Gaussian noise; (b) sample image 1 after adding salt and pepper noise; (c) sample image 2 after adding Gaussian noise; (d) sample image 2 after adding salt and pepper noise; (e) sample image 3 after adding Gaussian noise; (f) sample image 3 after adding salt and pepper noise
    Type of imageBrennerRobertsRoberts-energySMDEOGSMLSobelProposed algorithm
    Sample image 132.4827.2027.4626.5237.0543.3846.9625.18
    Sample image 232.3727.2027.3726.3936.4842.6546.7225.23
    Sample image 332.2427.2027.3926.4536.6142.9647.2225.29
    Table 1. Time delay required by different sharpness evaluation algorithms to process a frame of image unit: ms
    Type of imageIndexBrennerRobertsRoberts-energySMDEOGSMLSobelProposed algorithm
    Sample image 1fsen0.5390.3870.5840.3890.5850.6500.3180.688
    S0.3160.2380.3250.2380.3210.3330.2030.345
    Sample image 2fsen0.8850.8100.8730.8180.8680.8540.7830.912
    S0.4320.3800.4280.3850.4260.4230.3640.447
    Sample image 3fsen0.7760.5960.8000.6130.8140.8630.5400.789
    S0.3930.3020.4020.3090.4090.4310.2720.398
    Table 2. Sensitivity index of different algorithms
    Image typeNoise typeNoise parameterBrennerRobertsRbtEnergySMDEOGSMLSobelProposed algorithm
    Sample image 1Gaussiannoise0.011.2301.0601.1701.0301.1001.0501.1306.630
    0.021.1101.0301.0801.0201.0501.0301.0807.520
    0.051.0401.0201.0301.0201.0301.0301.0309.790
    Salt & peppernoise0.051.2001.2901.1501.2001.1001.0801.2206.600
    0.101.1001.1401.0801.0901.0601.0501.1207.560
    0.201.0701.0601.0501.0401.0401.0301.0509.870
    Sample image 2Gaussiannoise0.011.6471.1911.4901.1101.2801.1301.40618.330
    0.021.3131.0961.2301.0501.1201.0501.26021.720
    0.051.1001.0291.0691.0201.0401.0501.11030.510
    Salt & peppernoise0.051.5101.9701.4101.7001.2701.1901.93018.410
    0.101.2701.4601.2201.3301.1601.1201.42022.580
    0.201.1501.2001.1301.1401.1001.0901.17030.720
    Sample image 3Gaussiannoise0.011.2241.0731.1661.0351.0771.0571.19170.299
    0.021.0571.0271.0401.3441.0491.0661.07096.661
    0.051.0381.0171.0261.0231.0231.0311.044111.138
    Salt & peppernoise0.051.1391.0441.0991.0321.0511.0651.13378.777
    0.101.0491.0231.0331.0301.0361.0511.059101.441
    0.201.0251.0101.0181.0131.0081.0111.027122.629
    Table 3. Sharpness ratio of different sharpness evaluation algorithms in different noise environments
    Haifei Zeng, Changpei Han, Kai Li, Huangwei Tu. Improved Gradient Threshold Image Sharpness Evaluation Algorithm[J]. Laser & Optoelectronics Progress, 2021, 58(22): 2211001
    Download Citation