
Xin Wang, Kaijun Wu. Real-Time Semantic Segmentation Network Based on Octave Convolution[J]. Laser & Optoelectronics Progress, 2022, 59(8): 0810015
- Laser & Optoelectronics Progress
- Vol. 59, Issue 8, 0810015 (2022)
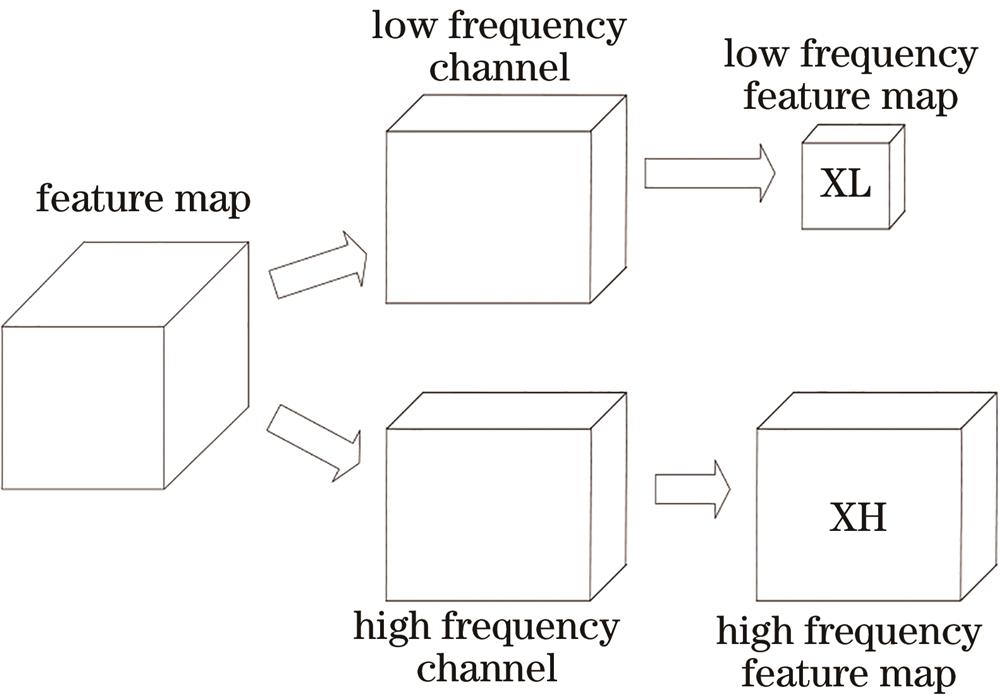
Fig. 1. High frequency and low frequency of feature map
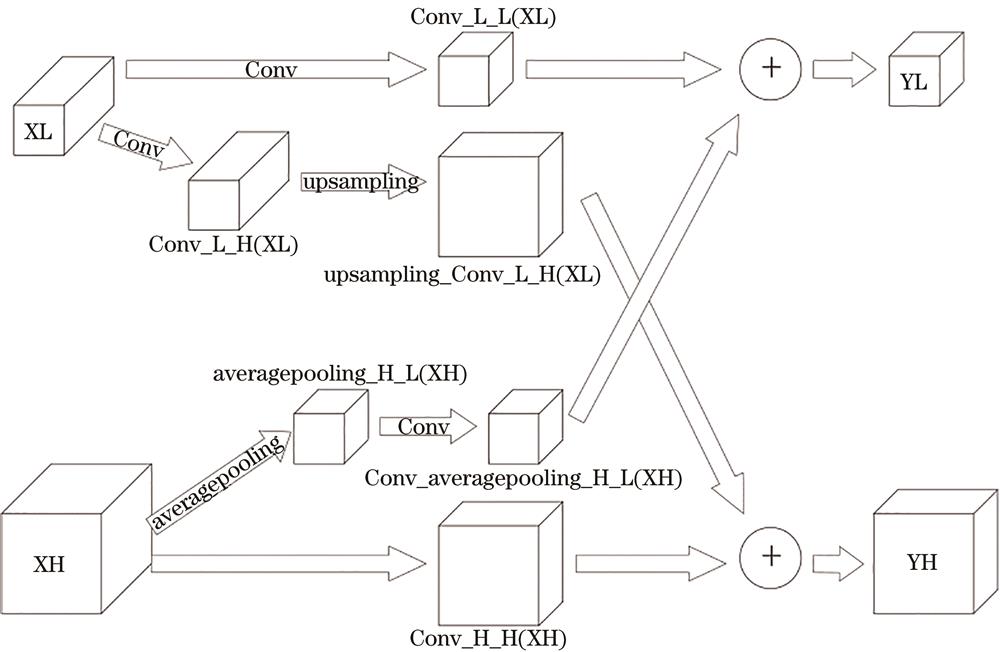
Fig. 2. Schematic of OctConv operation
Fig. 3. Comparison between swish and ReLU
Fig. 4. Comparison between swish function and hard-swish function
Fig. 5. OTCH-L module
Fig. 6. Proposed model
Fig. 7. Schematic of MIoU
Fig. 8. Influence of α on network performance
Fig. 9. Schematic of residual modules with different dimensionality reduction channels
Fig. 10. Comparison of experimental results
|
Table 1. Categories contained in the dataset
|
Table 2. Model super parameters
|
Table 3. Influence of different α values on model performance
|
Table 4. Performance comparison between neck blocks with different dimensionality reduction channels
|
Table 5. Performance comparison between different networks
|
Table 6. Performance comparison between the proposed network and a recent algorithm
|
Table 7. Performance comparison of different feature extraction networks

Set citation alerts for the article
Please enter your email address
© Copyright 2018-2021 | Chinese Laser Press. All Rights Reserved 沪ICP备15018463号-20