• Spectroscopy and Spectral Analysis
  • Vol. 41, Issue 10, 3123 (2021)
Chen-yang LIU1、*, Huang-rong XU2、2; 3;, Feng DUAN4、4;, Tai-sheng WANG1、1;, Zhen-wu LU1、1;, and Wei-xing YU3、3; *;
Author Affiliations
  • 11. State Key Laboratory of Applied Optics, Changchun Institute of Optics, Fine Mechanics & Physics, Chinese Academy of Sciences, Changchun 130033, China
  • 22. University of Chinese Academy of Sciences, Beijing 100049, China
  • 33. Key Laboratory of Spectral Imaging Technology, Xi’an Institute of Optics and Precision Mechanics, Chinese Academy of Science, Xi’an 710119, China
  • 44. Department of Interventional Radiology, the General Hospital of Chinese People’s Liberation Army, Beijing 100853, China
  • show less
    DOI: 10.3964/j.issn.1000-0593(2021)10-3123-06 Cite this Article
    Chen-yang LIU, Huang-rong XU, Feng DUAN, Tai-sheng WANG, Zhen-wu LU, Wei-xing YU. Spectral Discrimination of Rabbit Liver VX2 Tumor and Normal Tissue Based on Genetic Algorithm-Support Vector Machine[J]. Spectroscopy and Spectral Analysis, 2021, 41(10): 3123 Copy Citation Text show less
    Experimental apparatus for measuring VX2 tumor tissue and normal tissue in rabbit liver
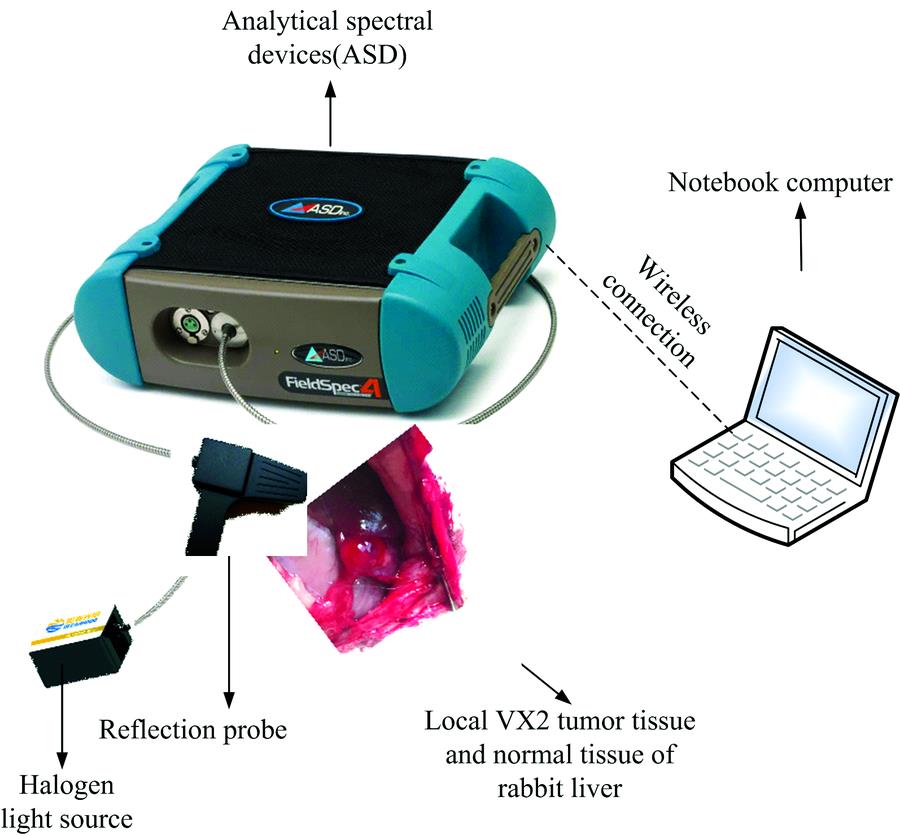
    Fig. 1. Experimental apparatus for measuring VX2 tumor tissue and normal tissue in rabbit liver
    Reflection of VX2 tumor tissue and normal tissue in rabbit liver (a) and spectral reflection of normal liver tissue in non-bleeding living body, VX2 tumor tissue in non-bleeding living body, normal liver tissue in bleeding isolated and VX2 tumor tissue in bleeding isolated (b)
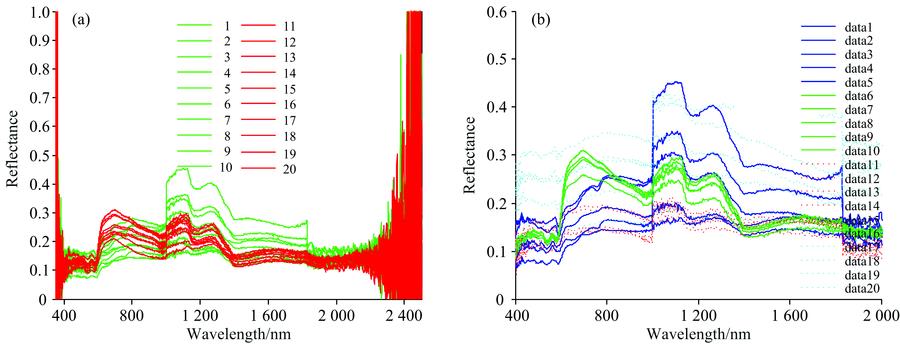
    Fig. 2. Reflection of VX2 tumor tissue and normal tissue in rabbit liver (a) and spectral reflection of normal liver tissue in non-bleeding living body, VX2 tumor tissue in non-bleeding living body, normal liver tissue in bleeding isolated and VX2 tumor tissue in bleeding isolated (b)
    The predicted and true values of two categories (a) and four categories (b) of SVM parameters are optimized by using 5-K cross validation
    Fig. 3. The predicted and true values of two categories (a) and four categories (b) of SVM parameters are optimized by using 5-K cross validation
    Fitness curves (a) and (b), classification results (c) and (d) of Two categories and Four categories optimized by genetic algorithm
    Fig. 4. Fitness curves (a) and (b), classification results (c) and (d) of Two categories and Four categories optimized by genetic algorithm
    Classification
    method
    Parameter optimization
    method
    Optimal values
    of c
    parameters
    Optimal values of
    kernel function
    parameter g
    The accuracy of
    the calibration
    set
    The accuracy
    of the prediction
    set
    Two categories5-fold cross validation40.125 0100%(130/130)100%(30/30)
    Genetic algorithm0.845 60.121 1100%(130/130)100%(30/30)
    Four categories5-fold cross validation80.062 599.242 4%(130/129)93.333%(30/27)
    Genetic algorithm5.530 70.068 599.242 4%(130/129)100%(30/30)
    Table 1. Compares the results of Two categories and Four categories of SVM parameters optimized by two methods
    Classification
    method
    Optimal values
    of c
    parameters
    Optimal values
    of kernel function
    parameter g
    The number
    of variables
    Running time
    of algorithm
    /s
    The accuracy of
    the calibration
    set/%
    The accuracy of
    the prediction
    set/%
    Genetic
    algorithm-
    Two categories
    0.845 60.121 11 401340.26100100
    5.220 60.294 4902221.026100100
    1.213 21.463 428083.7410096.67
    2.604 11.539 814044.2810096.67
    5.600 71.857 59432.9010096.67
    5.532 12.919 47027.3610096.67
    3.341 61.686 35619.5110096.67
    7.952 82.465 04720.22100100
    8.252 61.590 53517.5499.2496.67
    9.911 71.363 31411.4199.2493.33
    Genetic
    algorithm-
    Four categories
    5.530 70.068 51 401490.9999.24100
    7.670 80.062 3902298.9799.2493.33
    7.177 70.292 628083.6410093.33
    3.604 40.957 114072.0599.2493.33
    5.538 00.813 59448.5999.2493.33
    6.360 32.011 97045.1710096.67
    9.107 51.019 65635.3799.2496.67
    3.909 32.436 14731.8498.4896.67
    7.675 21.633 23527.8798.4893.33
    5.741 34.335 51421.0299.2493.33
    Table 2. The results of Two categories and Four categories under different number variables of SVM parameter optimized by Genetic algorithm
    Chen-yang LIU, Huang-rong XU, Feng DUAN, Tai-sheng WANG, Zhen-wu LU, Wei-xing YU. Spectral Discrimination of Rabbit Liver VX2 Tumor and Normal Tissue Based on Genetic Algorithm-Support Vector Machine[J]. Spectroscopy and Spectral Analysis, 2021, 41(10): 3123
    Download Citation