
Jingwei Song, Changwei Li, Sijiong Zhang. Quantitative Phase Imaging Based on Defocused Shack-Hartmann Sensor[J]. Acta Optica Sinica, 2021, 41(9): 0911002
- Acta Optica Sinica
- Vol. 41, Issue 9, 0911002 (2021)
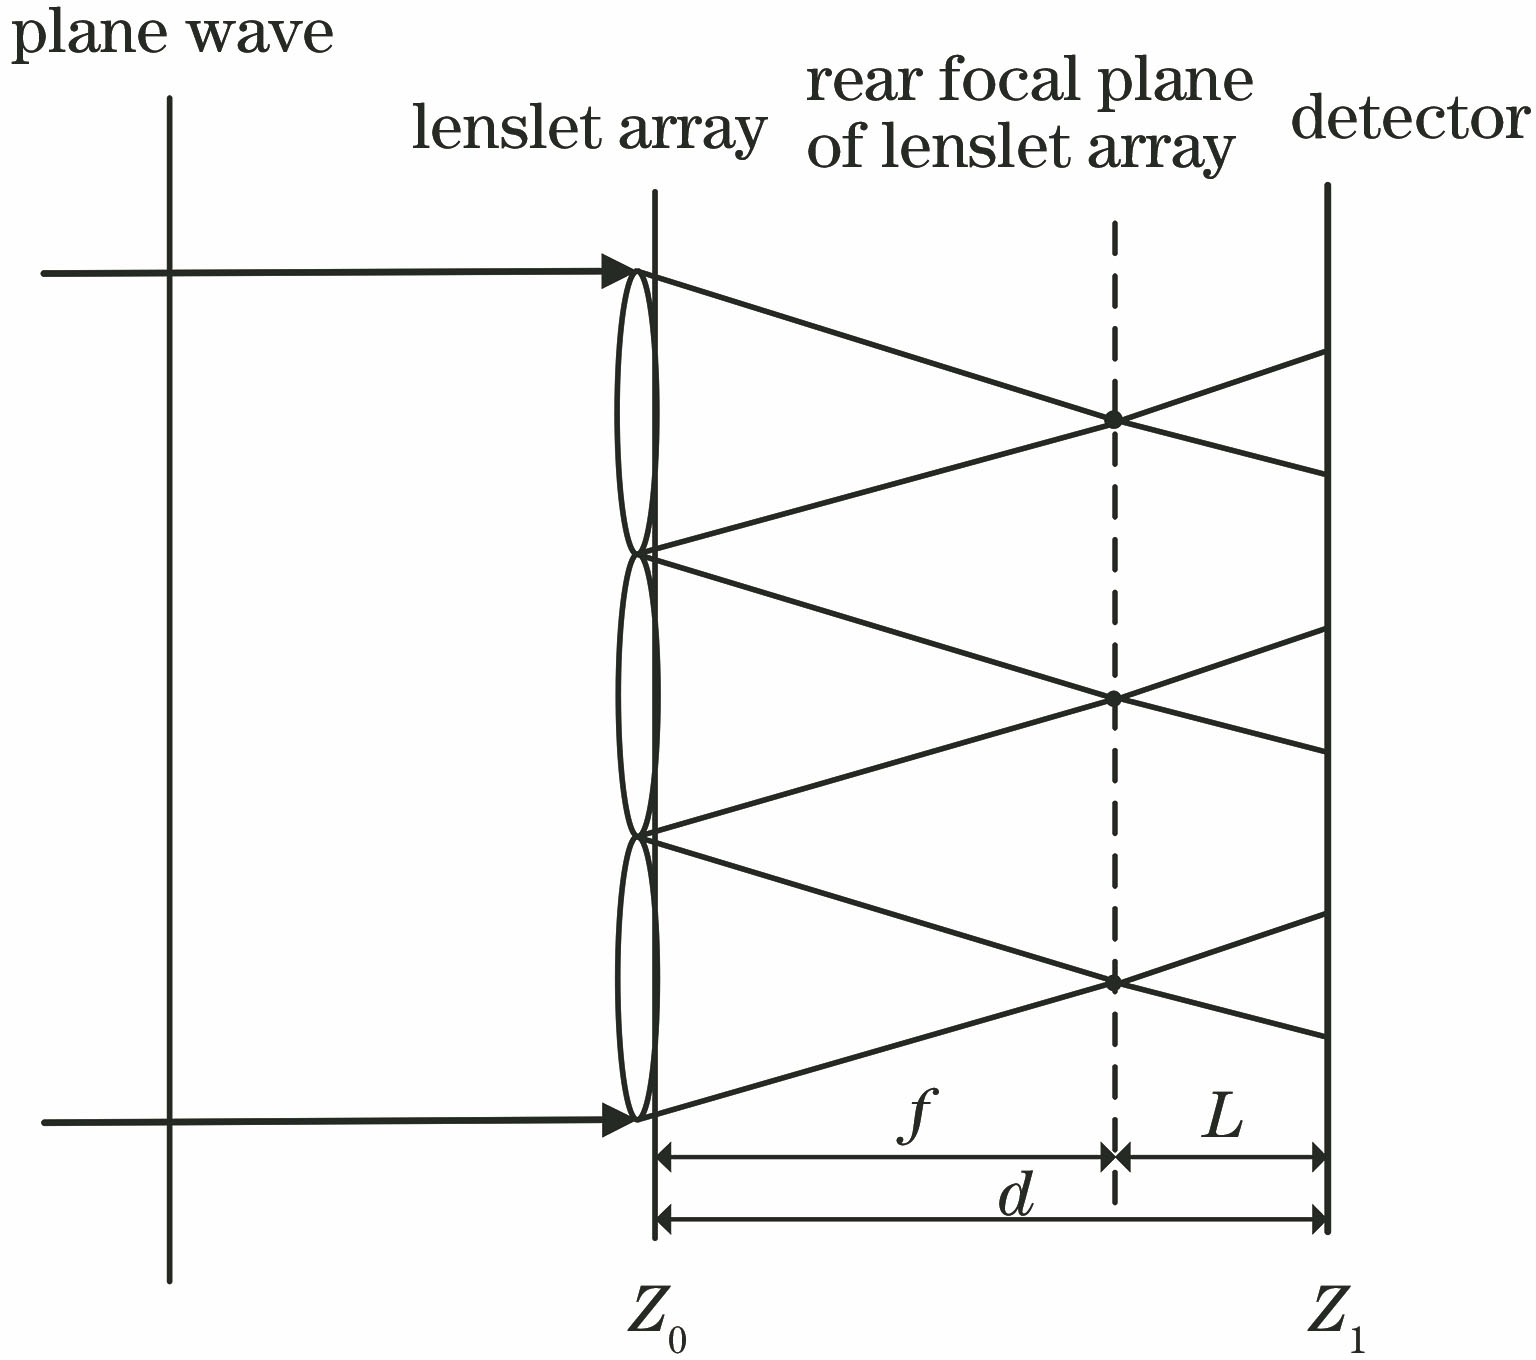
Fig. 1. Schematic of defocused Shack-Hartmann wavefront sensor
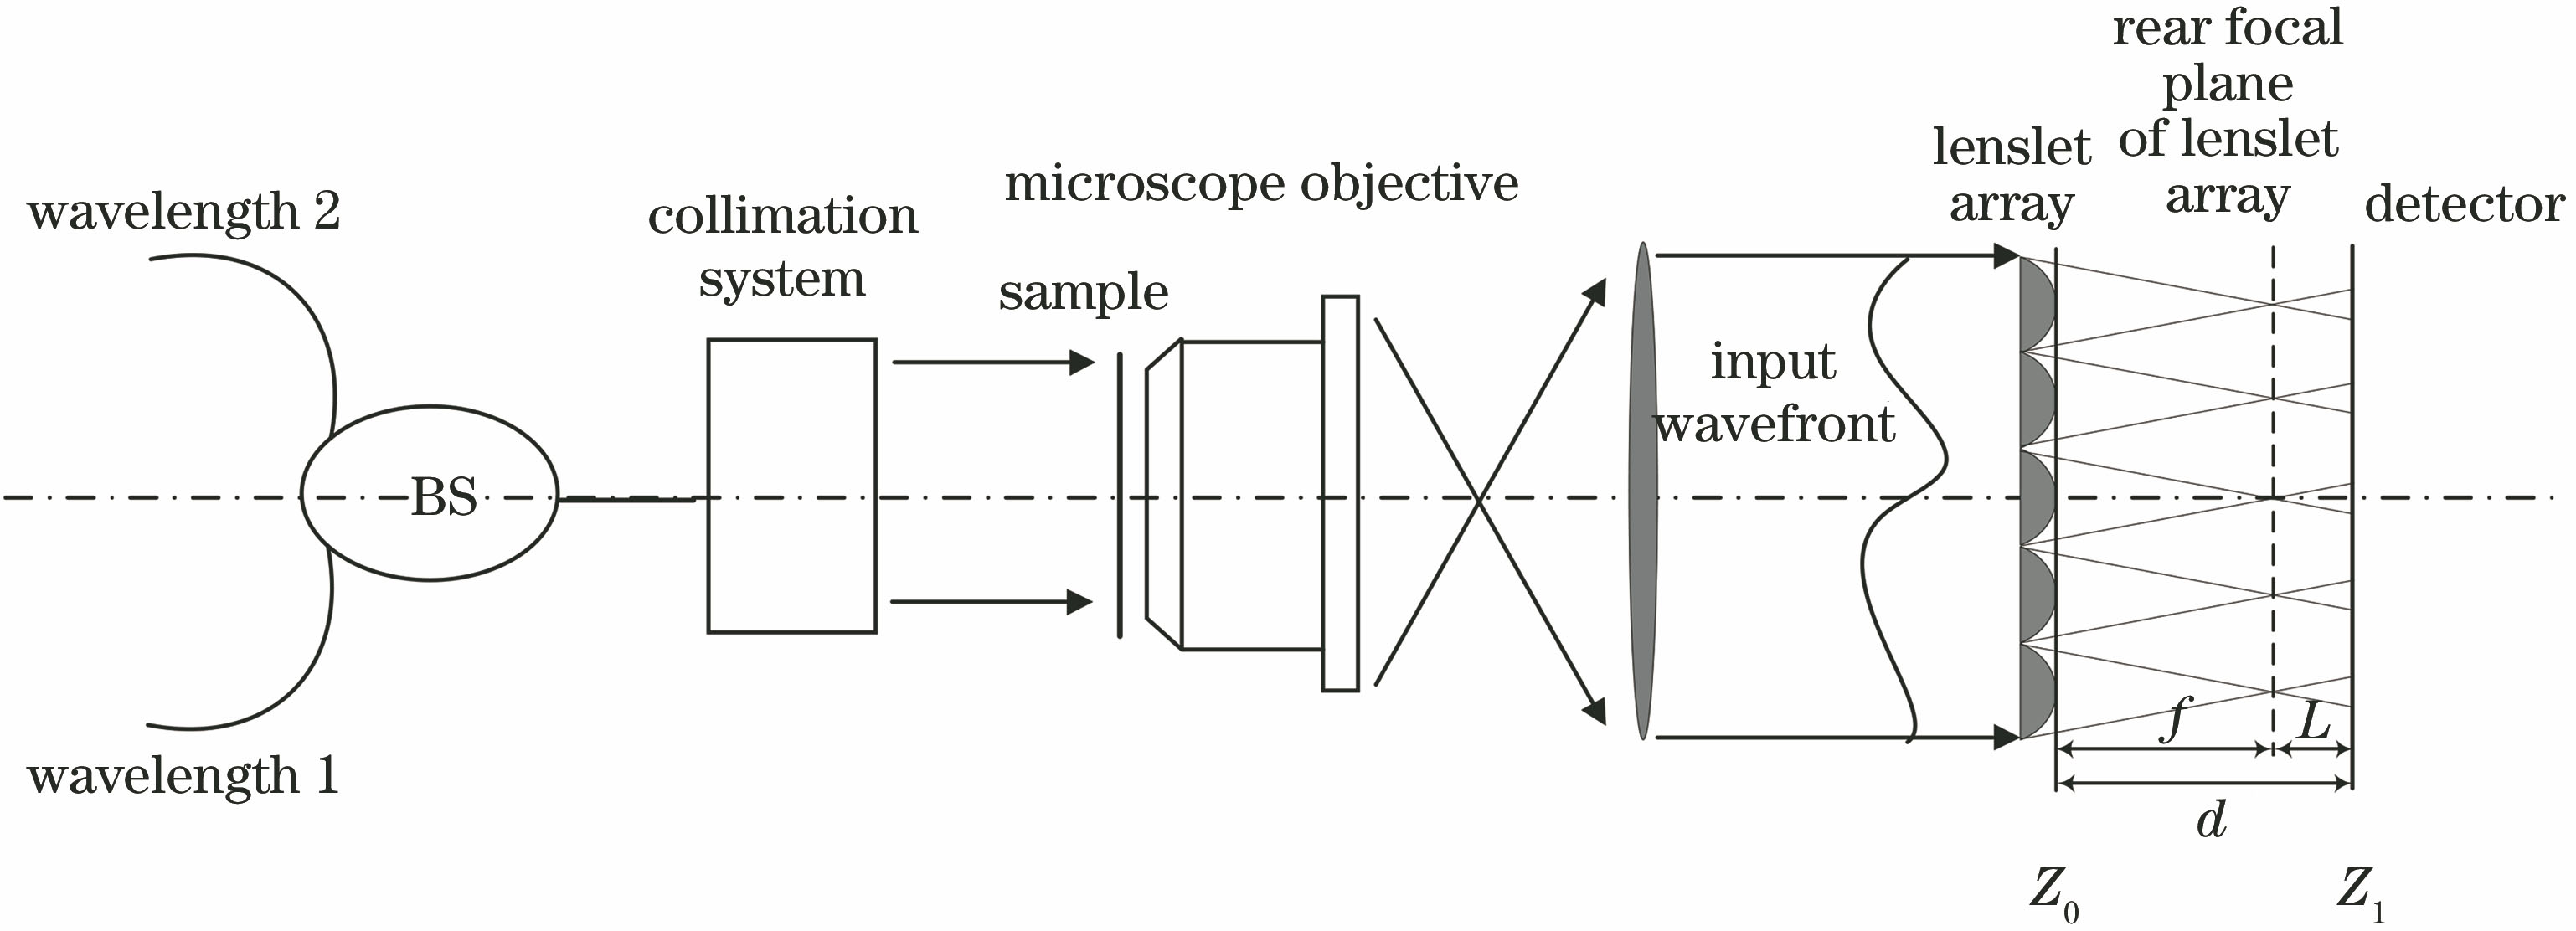
Fig. 2. Diagram of experimental setup for quantative phase imaging
Fig. 3. Phase retrieval flowchart
Fig. 4. Optical path difference of microlens array. (a) Result of phase imaging; (b) difference between theoretical value and phase imaging result
Fig. 5. Phase imaging results of phase screen. (a) Input optical path difference; (b) optical path difference of phase imaging; (c) residual error
Fig. 6. Curve of evaluation function
Fig. 7. Phase imaging results of phase objects. (a) Optical path difference caused by object; (b) optical path difference obtained by phase imaging; (c) residual error
Fig. 8. Curve of evaluation function
Fig. 9. Phase imaging results of grating. (a) Input optical path difference; (b) optical path difference of phase imaging; (c) residual error
Fig. 10. Curve of evaluation function
Fig. 11. Evaluation function curves. (a) C1 and C2; (b) C3 and C4
Fig. 12. Optical path difference and residual error of phase object imaging under different SNR. (a) 20 dB; (b) 30 dB; (c) 40 dB
|
Table 1. Error of phase imaging under different SNR

Set citation alerts for the article
Please enter your email address
© Copyright 2018-2021 | Chinese Laser Press. All Rights Reserved 沪ICP备15018463号-20