• Matter and Radiation at Extremes
  • Vol. 6, Issue 3, 038402 (2021)
Xiehang Chen1, Hongbo Lou1, Zhidan Zeng1, Benyuan Cheng1、2, Xin Zhang1, Ye Liu1, Dazhe Xu1, Ke Yang3, and Qiaoshi Zeng1、4、a)
Author Affiliations
  • 1Center for High Pressure Science and Technology Advanced Research, Pudong, Shanghai 201203, People’s Republic of China
  • 2Shanghai Institute of Laser Plasma, Shanghai 201800, People’s Republic of China
  • 3Shanghai Synchrotron Radiation Facility, Shanghai 201800, People’s Republic of China
  • 4Jiangsu Key Laboratory of Advanced Metallic Materials, School of Materials Science and Engineering, Southeast University, Nanjing 211189, People’s Republic of China
  • show less
    DOI: 10.1063/5.0044893 Cite this Article
    Xiehang Chen, Hongbo Lou, Zhidan Zeng, Benyuan Cheng, Xin Zhang, Ye Liu, Dazhe Xu, Ke Yang, Qiaoshi Zeng. Structural transitions of 4:1 methanol–ethanol mixture and silicone oil under high pressure[J]. Matter and Radiation at Extremes, 2021, 6(3): 038402 Copy Citation Text show less
    Pressure dependence of hydrostaticity inside the sample chamber of a DAC with a 4:1 ME mixture as the PTM. The hydrostaticity was characterized by the different pressures (open symbols, left vertical axis) obtained from three ruby balls at different locations inside the sample chamber and their standard deviation (solid symbols, right vertical axis). The arrow marks the onset pressure of nonhydrostaticity. The inset shows an image of the 4:1 ME mixture at ∼9 GPa along with the three ruby balls inside the DAC.
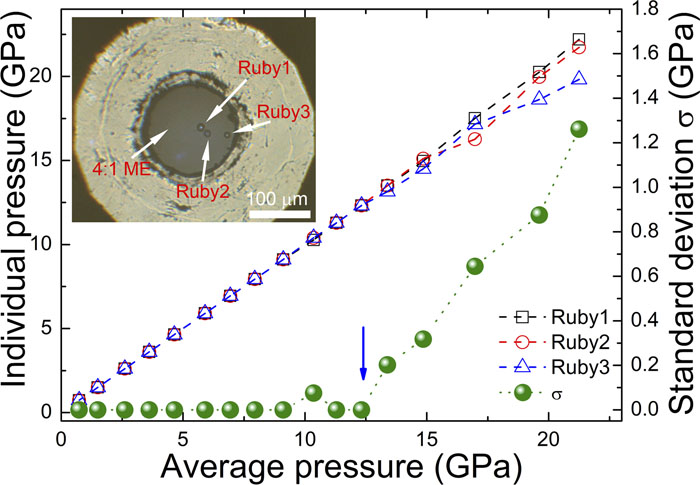
    Fig. 1. Pressure dependence of hydrostaticity inside the sample chamber of a DAC with a 4:1 ME mixture as the PTM. The hydrostaticity was characterized by the different pressures (open symbols, left vertical axis) obtained from three ruby balls at different locations inside the sample chamber and their standard deviation (solid symbols, right vertical axis). The arrow marks the onset pressure of nonhydrostaticity. The inset shows an image of the 4:1 ME mixture at ∼9 GPa along with the three ruby balls inside the DAC.
    In situ high-pressure XRD of the 4:1 ME mixture. (a) XRD patterns of the 4:1 ME mixture from 0.8 GPa to 22.2 GPa during compression and decompression. The numbers on the patterns denote their pressures, and the red and blue solid lines indicate the compression and decompression directions, respectively. (b) and (c) Pressure dependences of the principal diffraction peak position and peak width. (d) Pressure dependence of the sample volume estimated by the cubic power law and compared with volume data from the literature.35 The dashed lines are the third-order BM-EOS fittings of the volume data obtained in this work below 12 GPa (red dashed line) and above 12 GPa (blue dashed line). The arrows in (b)–(d) mark the critical pressures for possible transitions. The horizontal error bars represent pressure uncertainty due to nonhydrostaticity. The fitting errors of the peaks are smaller than the symbol size.
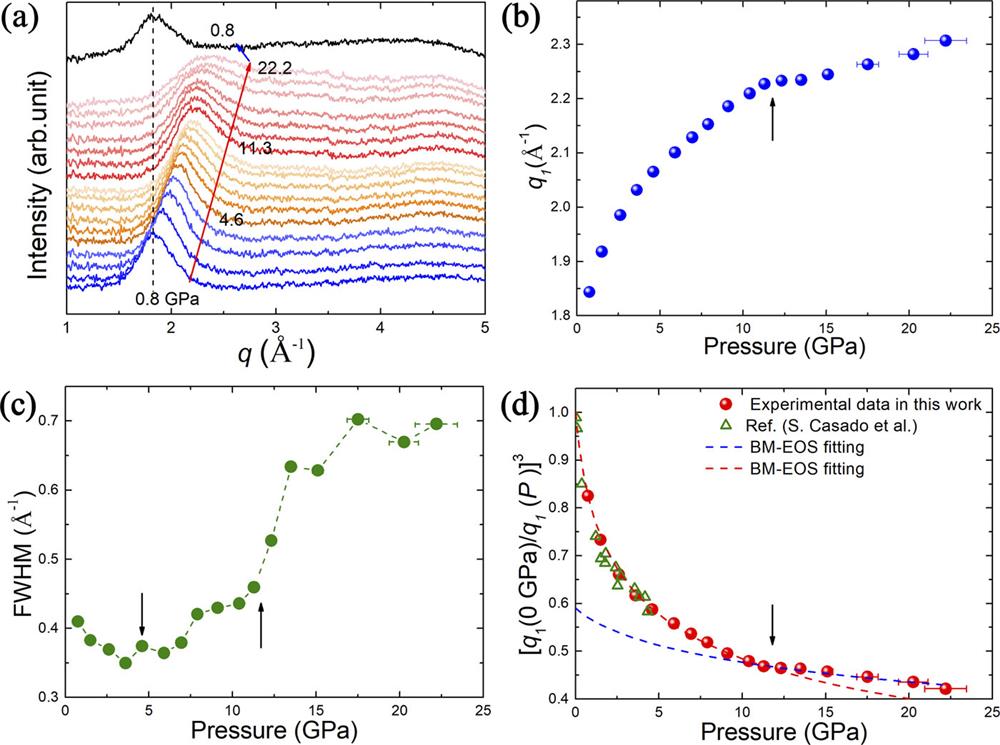
    Fig. 2. In situ high-pressure XRD of the 4:1 ME mixture. (a) XRD patterns of the 4:1 ME mixture from 0.8 GPa to 22.2 GPa during compression and decompression. The numbers on the patterns denote their pressures, and the red and blue solid lines indicate the compression and decompression directions, respectively. (b) and (c) Pressure dependences of the principal diffraction peak position and peak width. (d) Pressure dependence of the sample volume estimated by the cubic power law and compared with volume data from the literature.35 The dashed lines are the third-order BM-EOS fittings of the volume data obtained in this work below 12 GPa (red dashed line) and above 12 GPa (blue dashed line). The arrows in (b)–(d) mark the critical pressures for possible transitions. The horizontal error bars represent pressure uncertainty due to nonhydrostaticity. The fitting errors of the peaks are smaller than the symbol size.
    In situ high-pressure Raman spectra of the 4:1 ME mixture during compression and decompression. The spectra are collected in two separate regions owing to the limited coverage of the Raman spectrometer. The scale break on the horizontal axis omits the spectrum near the strong diamond Raman peak at ∼1332 cm−1. The red and blue dashed lines indicate the compression and decompression processes, respectively. The solid circles mark the peaks from methanol, while the solid diamond symbols mark the peaks from ethanol.
    Fig. 3. In situ high-pressure Raman spectra of the 4:1 ME mixture during compression and decompression. The spectra are collected in two separate regions owing to the limited coverage of the Raman spectrometer. The scale break on the horizontal axis omits the spectrum near the strong diamond Raman peak at ∼1332 cm−1. The red and blue dashed lines indicate the compression and decompression processes, respectively. The solid circles mark the peaks from methanol, while the solid diamond symbols mark the peaks from ethanol.
    Pressure dependence of hydrostaticity inside the sample chamber of a DAC with silicone oil as the PTM. The hydrostaticity was characterized by the different pressures (open symbols, left vertical axis) obtained from two ruby balls near the center and edge of the sample chamber and their standard deviation (solid symbols, right vertical axis). The arrows mark the pressures at dramatic changes in hydrostaticity. The inset shows an image of the silicone oil at ∼1 GPa along with the two ruby balls inside the DAC.
    Fig. 4. Pressure dependence of hydrostaticity inside the sample chamber of a DAC with silicone oil as the PTM. The hydrostaticity was characterized by the different pressures (open symbols, left vertical axis) obtained from two ruby balls near the center and edge of the sample chamber and their standard deviation (solid symbols, right vertical axis). The arrows mark the pressures at dramatic changes in hydrostaticity. The inset shows an image of the silicone oil at ∼1 GPa along with the two ruby balls inside the DAC.
    In situ high-pressure XRD of silicone oil. (a) XRD patterns of silicone oil from 1.1 GPa to 30.4 GPa during compression and decompression to ∼0.4 GPa. The black dashed lines are guides to the eye to show the trend in the shift of peak position with increasing pressure. The numbers on the patterns denote their pressures. The blue dotted pattern is at ∼0.4 GPa during decompression. (b) Pressure dependence of the principal diffraction peak position (solid blue circles, left vertical axis) and peak width (solid red squares, right vertical axis) as obtained by fitting the principal XRD peaks using a Voigt line profile. The arrows mark the critical pressures for possible transitions. The horizontal error bars represent pressure uncertainty due to nonhydrostaticity. The fitting errors of the peaks are smaller than the symbol size.
    Fig. 5. In situ high-pressure XRD of silicone oil. (a) XRD patterns of silicone oil from 1.1 GPa to 30.4 GPa during compression and decompression to ∼0.4 GPa. The black dashed lines are guides to the eye to show the trend in the shift of peak position with increasing pressure. The numbers on the patterns denote their pressures. The blue dotted pattern is at ∼0.4 GPa during decompression. (b) Pressure dependence of the principal diffraction peak position (solid blue circles, left vertical axis) and peak width (solid red squares, right vertical axis) as obtained by fitting the principal XRD peaks using a Voigt line profile. The arrows mark the critical pressures for possible transitions. The horizontal error bars represent pressure uncertainty due to nonhydrostaticity. The fitting errors of the peaks are smaller than the symbol size.
    In situ high-pressure Raman spectra of silicone oil during compression and decompression. The spectra are collected in two separate regions owing to the limited coverage of the Raman spectrometer. The red and blue dashed lines indicate the compression and decompression processes, respectively.
    Fig. 6. In situ high-pressure Raman spectra of silicone oil during compression and decompression. The spectra are collected in two separate regions owing to the limited coverage of the Raman spectrometer. The red and blue dashed lines indicate the compression and decompression processes, respectively.
    Xiehang Chen, Hongbo Lou, Zhidan Zeng, Benyuan Cheng, Xin Zhang, Ye Liu, Dazhe Xu, Ke Yang, Qiaoshi Zeng. Structural transitions of 4:1 methanol–ethanol mixture and silicone oil under high pressure[J]. Matter and Radiation at Extremes, 2021, 6(3): 038402
    Download Citation