• Laser & Optoelectronics Progress
  • Vol. 60, Issue 7, 0730006 (2023)
Shaohui Sheng, Boyang Xue, Zhangjun Wang*, Chao Chen, Xianxin Li, Yang Yu, Feng Zhang, Xin Pan, Quanfeng Zhuang, Hui Li, and Xiufen Wang
Author Affiliations
  • Institute of Oceanographic Instrumentation, Shandong Academy of Sciences, Qilu University of Technology (Shandong Academy of Sciences), Qingdao 266100, Shandong, China
  • show less
    DOI: 10.3788/LOP220484 Cite this Article Set citation alerts
    Shaohui Sheng, Boyang Xue, Zhangjun Wang, Chao Chen, Xianxin Li, Yang Yu, Feng Zhang, Xin Pan, Quanfeng Zhuang, Hui Li, Xiufen Wang. Overall Temporal Diagnostic and Spectral Normalization of Liquid Phase Laser-Induced Breakdown Spectroscopy Using Laser-Beam-Transmission Probe[J]. Laser & Optoelectronics Progress, 2023, 60(7): 0730006 Copy Citation Text show less
    Liquid phase LIBS and laser-beam-transmission, combined detection. (a) Experimental setup; (b) timing sequences
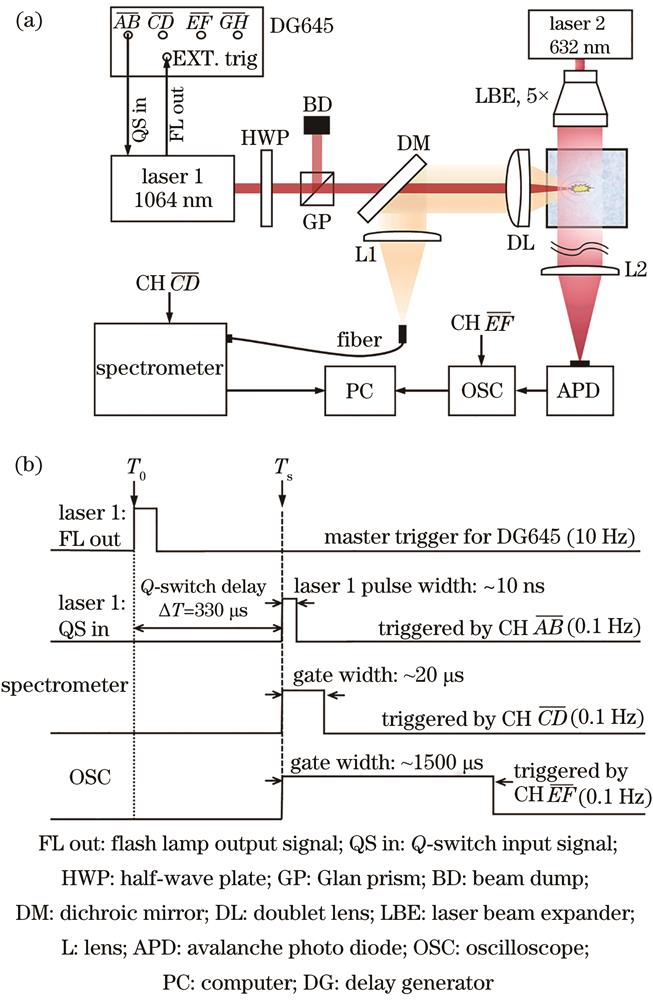
    Fig. 1. Liquid phase LIBS and laser-beam-transmission, combined detection. (a) Experimental setup; (b) timing sequences
    Typical five couples of LIBS signals and corresponding LBTP signals taken under same laser shot
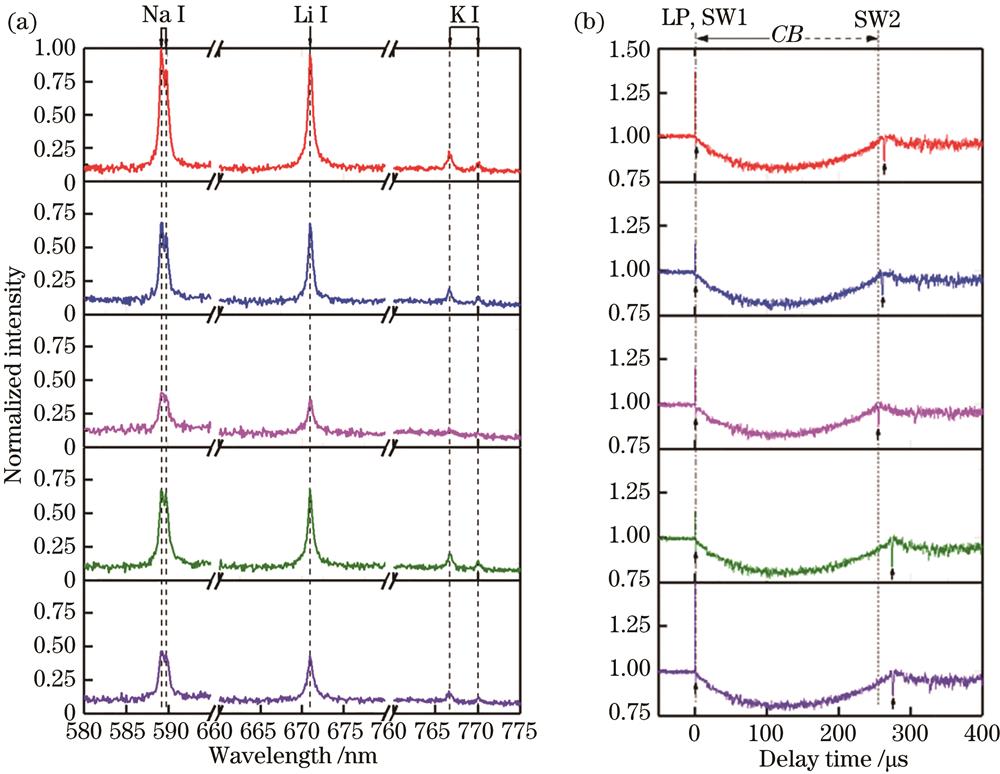
    Fig. 2. Typical five couples of LIBS signals and corresponding LBTP signals taken under same laser shot
    Breakdown probability as a function of laser pulse energy obtained by using LIBS data (squares, dash-dot line) and LBTP data (circles, short-dash line). Data are fitted with a Sigmoidal curve
    Fig. 3. Breakdown probability as a function of laser pulse energy obtained by using LIBS data (squares, dash-dot line) and LBTP data (circles, short-dash line). Data are fitted with a Sigmoidal curve
    (a) Peak area of Na (squares), Li (circles), and K (triangles) atomic lines and negative peak area of LBTP signal (stars) as a function of laser pulse energy and (b) correlation analysis between LIBS signal and LBTP signal
    Fig. 4. (a) Peak area of Na (squares), Li (circles), and K (triangles) atomic lines and negative peak area of LBTP signal (stars) as a function of laser pulse energy and (b) correlation analysis between LIBS signal and LBTP signal
    Comparison of LIBS results without and with the normalization by LBTP signals. (a) Peak intensity of Na I, (b) calibration curve of Na+, (c) peak intensity of Li I, (d) calibration curve of Li+, (e) peak intensity of K I, and (f) calibration curve of K+ before/after correction
    Fig. 5. Comparison of LIBS results without and with the normalization by LBTP signals. (a) Peak intensity of Na I, (b) calibration curve of Na+, (c) peak intensity of Li I, (d) calibration curve of Li+, (e) peak intensity of K I, and (f) calibration curve of K+ before/after correction
    Shaohui Sheng, Boyang Xue, Zhangjun Wang, Chao Chen, Xianxin Li, Yang Yu, Feng Zhang, Xin Pan, Quanfeng Zhuang, Hui Li, Xiufen Wang. Overall Temporal Diagnostic and Spectral Normalization of Liquid Phase Laser-Induced Breakdown Spectroscopy Using Laser-Beam-Transmission Probe[J]. Laser & Optoelectronics Progress, 2023, 60(7): 0730006
    Download Citation