
Qing-hu JIANG, Feng LIU, Dong-yue YU, Hui LUO, Qiong LIANG, Yan-jun ZHANG. Rapid Measurement of the Pharmacological Active Constituents in Herba Epimedii Using Hyperspectral Analysis Technology[J]. Spectroscopy and Spectral Analysis, 2022, 42(5): 1445
- Spectroscopy and Spectral Analysis
- Vol. 42, Issue 5, 1445 (2022)
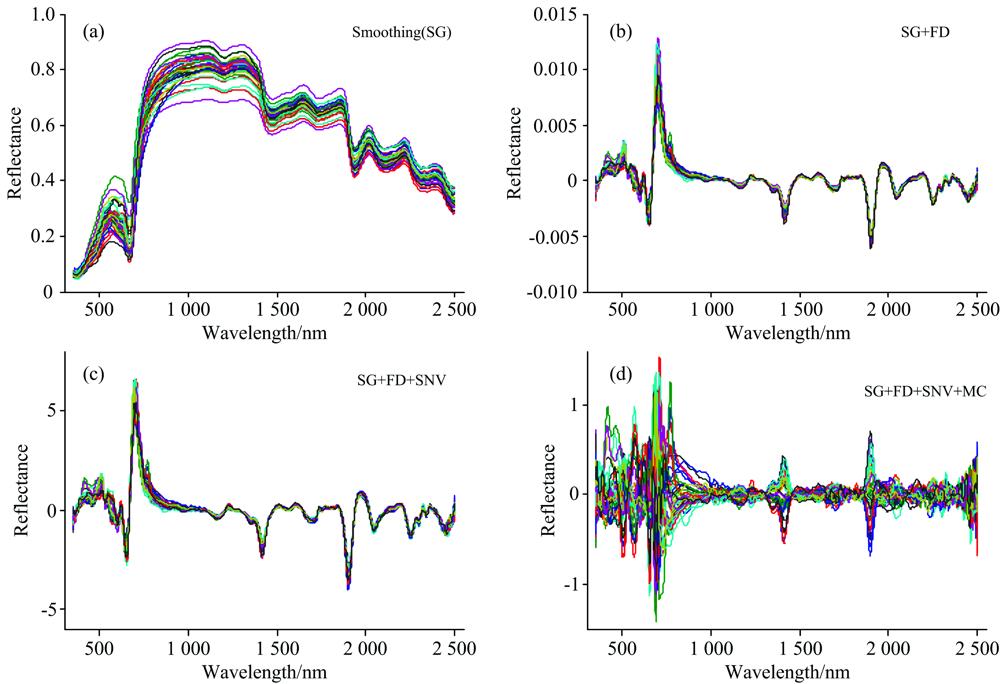
Fig. 1. Spectral reflectance curves after pretreatment with (a) SG; (b) SG and FD;(c) SG, FD and SNV; (d) SG, FD, SNV and MC
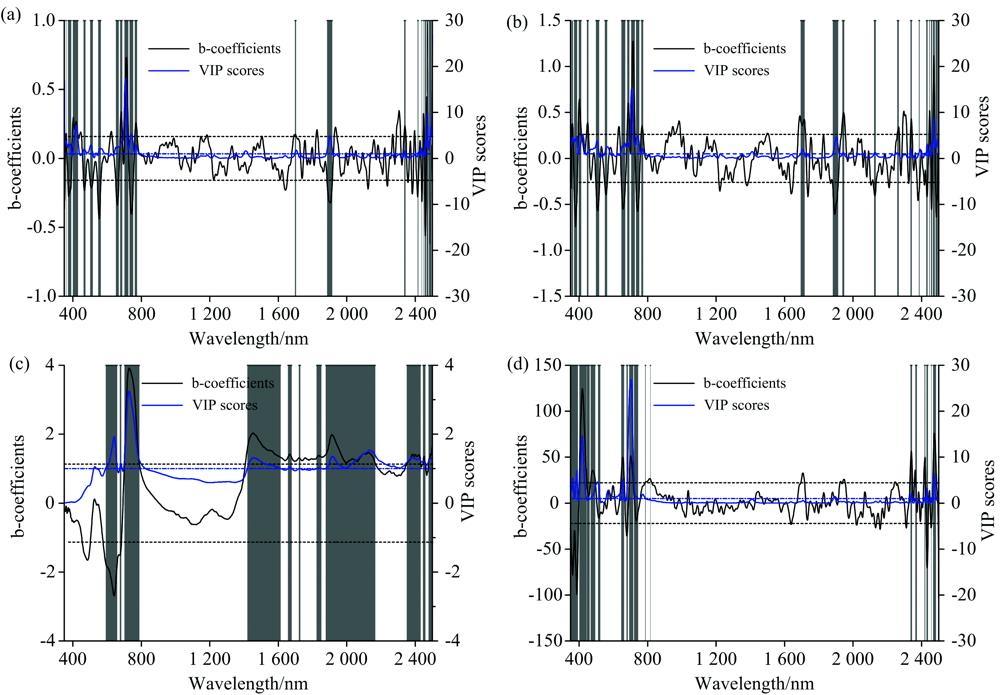
Fig. 2. VIP scores (blue line) and b -coefficients (black line) associated with the cross-validation of PLSR model for Epimedin A (a), Epimedin B (b), Epimedin C (c) and Icariin (d) predictions using Vis-NIR spectroscopy
Fig. 3. The important wavelengths of GA-PLSR model for Epimedin A, Epimedin B, Epimedin C and Icariin predictions
|
Table 1. Summary statistics of epimedin A, epimedin B, epimedin C, and icariin contents
| ||||||||||||||||||||||||||||||||||||||||||||||||||||||||||||||||||||||||
Table 2. Model construction and cross-validation

Set citation alerts for the article
Please enter your email address
© Copyright 2018-2021 | Chinese Laser Press. All Rights Reserved 沪ICP备15018463号-20