


Xiaopin Zhong, Junwei Zhu, Zhihao Lie, Yuanlong Deng. Anomaly Detection Method of Polarizer Appearance Based on Synthetic Defects[J]. Laser & Optoelectronics Progress, 2023, 60(14): 1415005
- Laser & Optoelectronics Progress
- Vol. 60, Issue 14, 1415005 (2023)
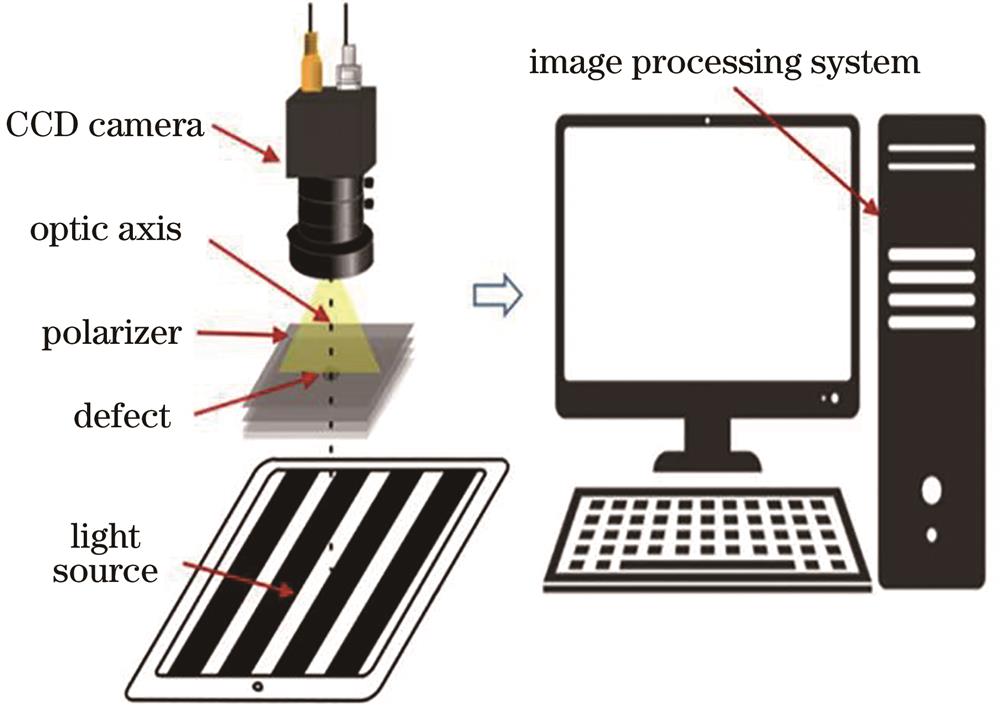
Fig. 1. Schematic diagram of polarizer imaging experiment system

Fig. 2. Structured light imaging enhancement effect (left, uniform light; right, structured light)
Fig. 3. Overall framework of proposed model
Fig. 4. Anti anomaly detection network model based on encoding and decoding structure
Fig. 5. Anomaly detection process based on synthetic defects
Fig. 6. Real defect examples. (a) Point defect; (b) foreign matter; (c) bubbles; (d) crease
Fig. 7. Examples of composite defects
Fig. 8. Hyperparametric selection diagram of model loss weight
Fig. 9. Relationship between number of training samples and model accuracy
Fig. 10. Comparison of reconstruction results of some normal samples
Fig. 11. Comparison of reconstruction effect of defect samples
Fig. 12. Abnormal score graph of 100 normal samples and 100 defective samples
Fig. 13. Precision-recall curve of various methods
Fig. 14. Interference dataset images
|
Table 1. Normal samples under different characteristics
|
Table 2. Effect comparison of different methods
|
Table 3. AUC difference between different methods and original data under interference data

Set citation alerts for the article
Please enter your email address
© Copyright 2018-2021 | Chinese Laser Press. All Rights Reserved 沪ICP备15018463号-20