Author Affiliations
1School of Geography and Planning, Sun Yat-Sen University, Guangzhou 510275, China1中山大学地理科学与规划学院,广州 5102752Guangdong Provincial Key Laboratory of Urbanization and Geo-simulation, Guangzhou 510275, China2广东省城市化与地理环境空间模拟重点实验室,广州510275show less
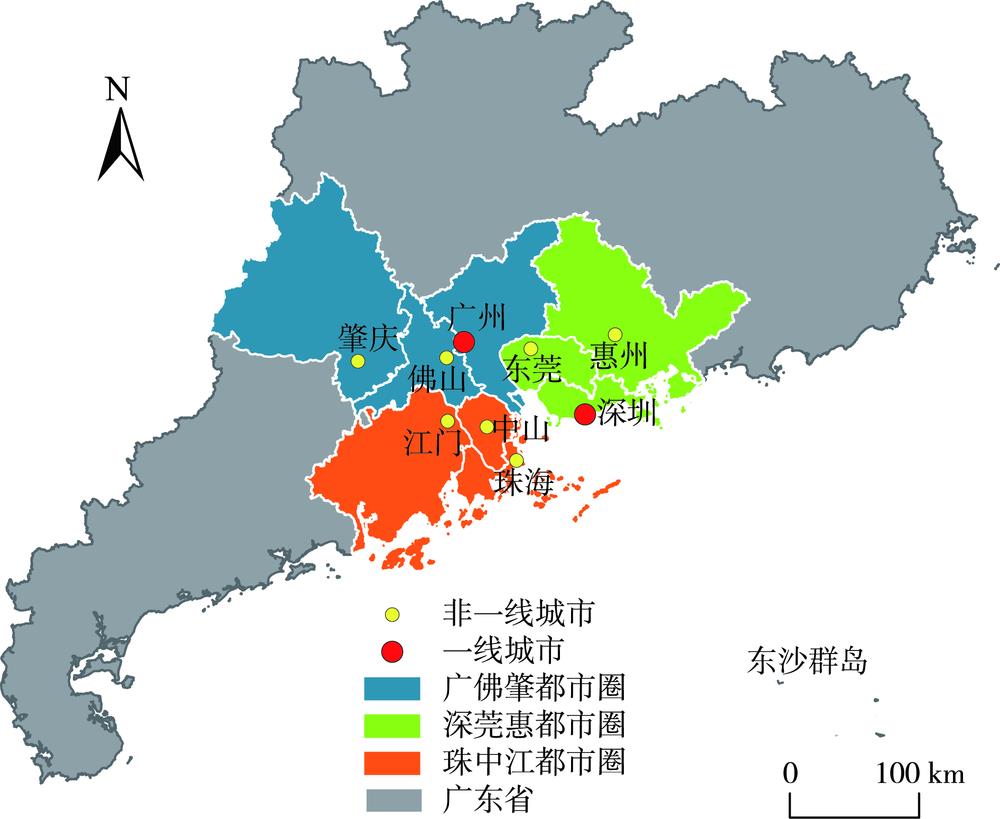
Fig. 1. The location of Pearl River Delta
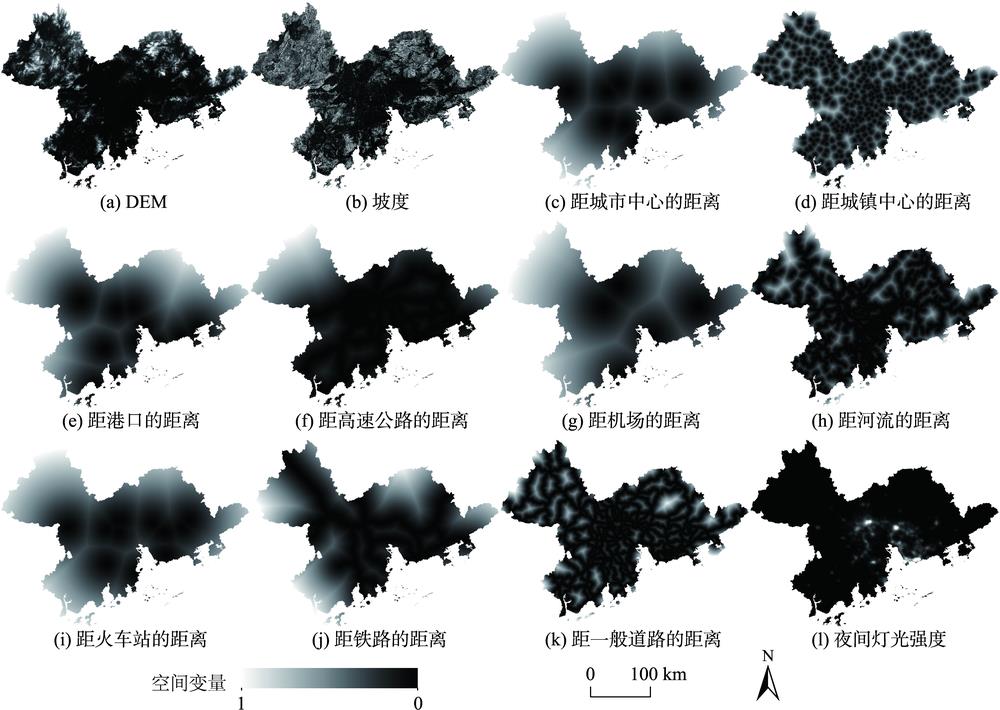
Fig. 2. Spatial variables of urban expansion simulation in Pearl River Delta
Fig. 3. Geospatial partition based on township streets
Fig. 4. Geospatial partition based on grid
Fig. 5. The framework of FLUS model
Fig. 6. The structure of CA model in FLUS model
Fig. 7. The geospatial partition result in Pearl River Delta
Fig. 8. Comparison of simulation results in Pearl River Delta in 2015
Fig. 9. Simulation of urban expansion for the years 2025, 2035 and 2045
Fig. 10. Integrated early warning results of urban expansion in Pearl River Delta from 2025 to 2045
| 影响层 | 指标层 |
|---|
| 城市扩张的形态影响 | C(紧凑度) | | SHAPE_MN(城市斑块平均形状指数) | | FRAC_MN(城市斑块平均分维数) | | ENN_MN(城市斑块平均最近邻距离) | | PD(平均斑块密度) | | AI(聚集指数) | | 城市扩张的生态影响 | SHDI(香农多样性指数) | | F_ AREA_MN(林地斑块平均面积指数) | | W_AREA_MN(水体斑块平均面积指数) | | C_MNN(耕地斑块平均最近邻距离指数) | | F_MNN(林地斑块平均最近邻距离指数) | | FGW_AR(林地、草地及水体面积占比率) | | U_FGW_AR(侵占林地、草地及水体的总面积占新增城市用地的面积比率) | | FGW_CR(林地、草地及水体面积变化率) | | U_C_AR(侵占耕地面积占新增城市用地面积的比率) | | U_EPZ_AR(侵占生态保护区面积占新增城市用地面积的比率) | | U_PCF_AR(侵占永久基本农田占新增城市用地面积的比率) | | 城市扩张的强度影响 | AREA_MN(城市斑块平均面积指数) | | PERIMETER_MN(城市斑块平均周长指数) | | UEI(城市用地扩张速率指数) | | UH_MN(城市扩张用地平均高程) | | US_MN(城市扩张用地平均坡度) |
|
Table 1. Early warning indicators for urban expansion in Pearl River Delta
| 影响层 | 权重 | 指标层 | 权重 |
|---|
| 城市扩张的形态影响 | 0.3 | C | 0.06 | | SHAPE_MN | 0.15 | | FRAC_MN | 0.10 | | ENN_MN | 0.34 | | PD | 0.28 | | AI | 0.07 | | 城市扩张的生态影响 | 0.5 | SHDI | 0.04 | | F_ AREA_MN | 0.05 | | W_AREA_MN | 0.04 | | C_MNN | 0.10 | | F_MNN | 0.09 | | FGW_AR | 0.02 | | U_FGW_AR | 0.13 | | FGW_CR | 0.08 | | U_C_AR | 0.07 | | U_EPZ_AR | 0.24 | | U_PCF_AR | 0.14 | | 城市扩张的强度影响 | 0.2 | AREA_MN | 0.12 | | PERIMETER_MN | 0.21 | | UEI | 0.48 | | UH_MN | 0.07 | | US_MN | 0.12 |
|
Table 2. Weights of early warning indicators for urban expansion in Pearl River Delta
| 区域 | 分区 | | 未分区 |
|---|
| OA/% | Kappa | FoM | OA/% | Kappa | FoM |
|---|
| 分区1 | 92.81 | 0.8826 | 0.1617 | | 93.37 | 0.8915 | 0.1466 | | 分区2 | 89.68 | 0.8570 | 0.3289 | | 88.47 | 0.8407 | 0.2625 | | 分区3 | 83.17 | 0.7532 | 0.3824 | | 79.97 | 0.7044 | 0.3466 | | 分区4 | 87.82 | 0.8351 | 0.3621 | | 88.24 | 0.8410 | 0.3231 | | 分区5 | 91.76 | 0.8619 | 0.1280 | | 90.55 | 0.8416 | 0.0899 | | 分区6 | 94.43 | 0.8262 | 0.0722 | | 95.05 | 0.8412 | 0.0735 | | 分区7 | 87.40 | 0.8166 | 0.1411 | | 88.11 | 0.8262 | 0.0858 | | 分区8 | 93.65 | 0.8520 | 0.1141 | | 94.36 | 0.8674 | 0.1011 | | 分区9 | 82.37 | 0.7443 | 0.2414 | | 82.80 | 0.7493 | 0.2505 | | 分区10 | 91.07 | 0.8409 | 0.1697 | | 91.50 | 0.8477 | 0.1430 | | 珠江三角洲 | 90.04 | 0.8418 | 0.2329 | | 90.32 | 0.8463 | 0.2127 |
|
Table 3. Accuracy comparison of simulation results under partitioned and unpartitioned scenarios in Pearl River Delta
| 区域 | 耕地 | 林地 | 草地 | 水体 | 城市 | 未利用地 |
|---|
| 分区1 | 1830.90 | 3387.38 | 282.44 | 455.70 | 441.32 | 0.20 | | 分区2 | 584.14 | 792.71 | 17.38 | 301.18 | 500.54 | 0.48 | | 分区3 | 1301.88 | 470.40 | 6.45 | 473.43 | 1921.88 | 0.95 | | 分区4 | 1216.81 | 1142.58 | 45.45 | 556.39 | 992.84 | 0.28 | | 分区5 | 856.72 | 2166.74 | 52.45 | 380.71 | 335.75 | 0.00 | | 分区6 | 1401.23 | 8739.94 | 306.72 | 172.99 | 208.79 | 0.32 | | 分区7 | 1054.23 | 1528.16 | 63.32 | 414.65 | 547.31 | 1.44 | | 分区8 | 1366.78 | 4665.10 | 142.02 | 126.71 | 189.26 | 0.67 | | 分区9 | 863.18 | 1678.80 | 74.20 | 407.43 | 2593.18 | 0.47 | | 分区10 | 1448.89 | 4059.79 | 177.35 | 235.21 | 818.44 | 0.94 | | 珠江三角洲 | 11 924.76 | 28 631.60 | 1167.79 | 3524.40 | 8549.33 | 5.74 |
|
Table 4. Area of land use type in Pearl River Delta in 2025 (km2)
| 区域 | 耕地 | 林地 | 草地 | 水体 | 城市 | 未利用地 |
|---|
| 分区1 | 1810.13 | 3318.92 | 304.97 | 483.88 | 479.93 | 0.11 | | 分区2 | 552.09 | 770.63 | 19.61 | 297.85 | 555.94 | 0.31 | | 分区3 | 1229.49 | 450.24 | 6.08 | 436.91 | 2051.36 | 0.91 | | 分区4 | 1184.11 | 1116.49 | 44.41 | 526.61 | 1082.45 | 0.28 | | 分区5 | 843.89 | 2143.37 | 56.27 | 374.93 | 373.90 | 0.00 | | 分区6 | 1397.98 | 8679.47 | 347.34 | 173.19 | 231.68 | 0.33 | | 分区7 | 988.42 | 1505.87 | 62.17 | 421.24 | 630.28 | 1.13 | | 分区8 | 1352.80 | 4634.83 | 156.18 | 133.51 | 212.58 | 0.63 | | 分区9 | 757.94 | 1623.29 | 67.79 | 402.38 | 2765.34 | 0.52 | | 分区10 | 1384.17 | 3996.43 | 176.81 | 244.53 | 937.76 | 0.93 | | 珠江三角洲 | 11 501.03 | 28 239.53 | 1241.64 | 3495.03 | 9321.22 | 5.15 |
|
Table 5. Area of land use type in Pearl River Delta in 2035 (km2)
| 区域 | 耕地 | 林地 | 草地 | 水体 | 城市 | 未利用地 |
|---|
| 分区1 | 1794.87 | 3256.80 | 323.86 | 510.33 | 511.99 | 0.10 | | 分区2 | 527.24 | 751.38 | 21.45 | 293.51 | 602.62 | 0.23 | | 分区3 | 1171.35 | 434.01 | 5.79 | 409.46 | 2153.51 | 0.87 | | 分区4 | 1156.35 | 1093.35 | 43.51 | 503.71 | 1157.15 | 0.28 | | 分区5 | 834.13 | 2121.45 | 59.40 | 370.11 | 407.29 | 0.00 | | 分区6 | 1398.02 | 8626.52 | 381.33 | 173.46 | 250.33 | 0.34 | | 分区7 | 939.43 | 1484.33 | 61.14 | 424.71 | 698.48 | 1.02 | | 分区8 | 1343.34 | 4607.75 | 168.14 | 139.59 | 231.10 | 0.61 | | 分区9 | 690.54 | 1580.65 | 63.09 | 397.12 | 2885.30 | 0.56 | | 分区10 | 1334.29 | 3938.84 | 176.26 | 253.11 | 1037.20 | 0.92 | | 珠江三角洲 | 11 189.56 | 27 895.08 | 1303.97 | 3475.12 | 9934.97 | 4.92 |
|
Table 6. Area of land use type in Pearl River Delta in 2045 (km2)
| 区域 | 2025年 | 2035年 | 2045年 |
|---|
| 分区1 | 中警 | 中警 | 重警 | | 分区2 | 轻警 | 中警 | 中警 | | 分区3 | 轻警 | 轻警 | 中警 | | 分区4 | 轻警 | 轻警 | 中警 | | 分区5 | 轻警 | 无警 | 中警 | | 分区6 | 轻警 | 轻警 | 中警 | | 分区7 | 轻警 | 中警 | 中警 | | 分区8 | 中警 | 中警 | 重警 | | 分区9 | 中警 | 中警 | 重警 | | 分区10 | 无警 | 轻警 | 中警 |
|
Table 7. Early warning level of urban expansion in each sub-region
| 城市 | 2025年 | 2035年 | 2045年 |
|---|
| 广州 | 轻警 | 轻警 | 中警 | | 佛山 | 无警 | 轻警 | 中警 | | 肇庆 | 无警 | 无警 | 中警 | | 深圳 | 轻警 | 轻警 | 中警 | | 东莞 | 重警 | 重警 | 重警 | | 惠州 | 无警 | 无警 | 无警 | | 珠海 | 轻警 | 轻警 | 中警 | | 中山 | 轻警 | 中警 | 中警 | | 江门 | 轻警 | 轻警 | 中警 |
|
Table 8. Early warning level of urban expansion in each city