• Laser & Optoelectronics Progress
  • Vol. 61, Issue 5, 0504002 (2024)
Qichuan Tan, Peng Zeng*, and Zheqi Yang
Author Affiliations
  • School of Materials and Energy, University of Electronic Science and Technology of China, Chengdu 611731, Sichuan , China
  • show less
    DOI: 10.3788/LOP230822 Cite this Article Set citation alerts
    Qichuan Tan, Peng Zeng, Zheqi Yang. Reconstructive Optical Spectrometer Using Perovskite Filter Arrays[J]. Laser & Optoelectronics Progress, 2024, 61(5): 0504002 Copy Citation Text show less
    Illustration of the working principle of the filter-array-based reconstructive optical spectrometer. (a) Schematic diagram of the filter-array-based reconstructive optical spectrometer; (b) illustration of the working principle of the filter array; (c) schematic diagram of the discretized spectra
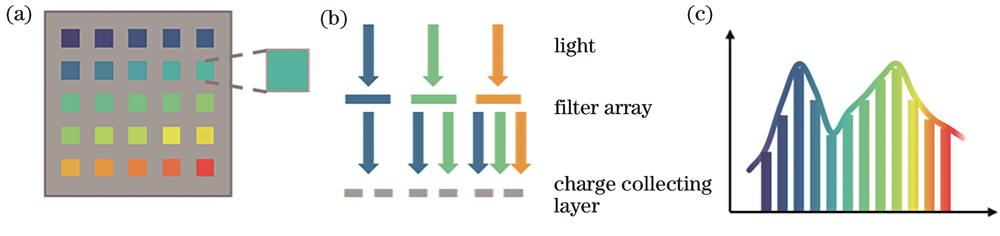
    Fig. 1. Illustration of the working principle of the filter-array-based reconstructive optical spectrometer. (a) Schematic diagram of the filter-array-based reconstructive optical spectrometer; (b) illustration of the working principle of the filter array; (c) schematic diagram of the discretized spectra
    Absorbance and transmissivity characteristics of the filter array (the numbers of the curves correspond to those of perovskites in Table 1). (a) Absorbance of the filter array; (b) transmissivity of the filter array
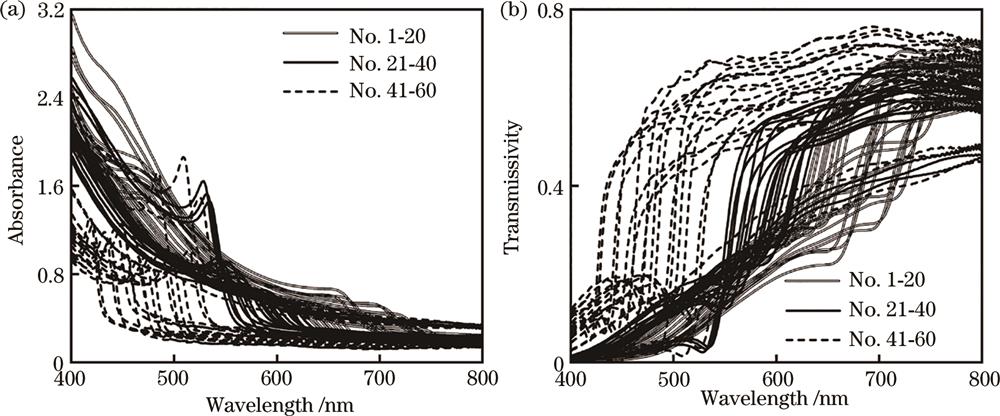
    Fig. 2. Absorbance and transmissivity characteristics of the filter array (the numbers of the curves correspond to those of perovskites in Table 1). (a) Absorbance of the filter array; (b) transmissivity of the filter array
    Illustration of the spectormeter and camera characteristics. (a) Quantum efficiency of the CMOS camera; (b) photo of the reconstructive optical spectrometer
    Fig. 3. Illustration of the spectormeter and camera characteristics. (a) Quantum efficiency of the CMOS camera; (b) photo of the reconstructive optical spectrometer
    Comparison of the XRD between the Cs0.1MA0.9PbBr1.5I1.5 obtained by N2-assisted crystallization method and MAPbBr1.5I1.5 obtained by chlorobenzene anti-solvent method
    Fig. 4. Comparison of the XRD between the Cs0.1MA0.9PbBr1.5I1.5 obtained by N2-assisted crystallization method and MAPbBr1.5I1.5 obtained by chlorobenzene anti-solvent method
    SEM of Cs0.1MA0.9PbBr1.5I1.5 film obtained by different methods. (a) Chlorobenzene anti-solvent method; (b) N2-assisted crystallization method
    Fig. 5. SEM of Cs0.1MA0.9PbBr1.5I1.5 film obtained by different methods. (a) Chlorobenzene anti-solvent method; (b) N2-assisted crystallization method
    Comparison of time course photoluminescence spectra of different films. (a) Time course photoluminescence spectrum of MAPbBr1.5I1.5; (b) time course photoluminescence spectrum of Cs0.1MA0.9PbBr1.5I1.5+2PACz
    Fig. 6. Comparison of time course photoluminescence spectra of different films. (a) Time course photoluminescence spectrum of MAPbBr1.5I1.5; (b) time course photoluminescence spectrum of Cs0.1MA0.9PbBr1.5I1.5+2PACz
    Schematic diagram of the optics for spectrometer tests using a Xe lamp with a monochromator
    Fig. 7. Schematic diagram of the optics for spectrometer tests using a Xe lamp with a monochromator
    Reconstruction of the monochromatic spectrum. (a) Comparison between the original and reconstructed spectrum of the monochromatic light with a center wavelength of 500 nm; (b) comparison between the original and reconstructed spectrum of the monochromatic light with a center wavelength of 600 nm
    Fig. 8. Reconstruction of the monochromatic spectrum. (a) Comparison between the original and reconstructed spectrum of the monochromatic light with a center wavelength of 500 nm; (b) comparison between the original and reconstructed spectrum of the monochromatic light with a center wavelength of 600 nm
    Comparison between the original and reconstructed spectrum of the broad-band white light from a flashlamp
    Fig. 9. Comparison between the original and reconstructed spectrum of the broad-band white light from a flashlamp
    No.xyNo.xyNo.xyNo.xy
    10.000.00160.000.38310.000.75460.210.79
    20.000.03170.000.40320.000.78470.260.74
    30.000.05180.000.43330.000.80480.300.70
    40.000.08190.000.45340.000.83490.340.66
    50.000.10200.000.48350.000.85500.390.61
    60.000.13210.000.50360.000.88510.430.57
    70.000.15220.000.53370.000.90520.470.53
    80.000.18230.000.55380.000.93530.510.49
    90.000.20240.000.58390.000.95540.560.44
    100.000.23250.000.60400.000.98550.600.40
    110.000.25260.000.63410.001.00560.640.36
    120.000.28270.000.65420.040.96570.690.31
    130.000.30280.000.68430.090.91580.730.27
    140.000.33290.000.70440.130.87590.770.23
    150.000.35300.000.73450.170.83600.810.19
    Table 1. Value of x and y in Cs0.1MA0.9Pb(ClxBryI1-xy)3
    Qichuan Tan, Peng Zeng, Zheqi Yang. Reconstructive Optical Spectrometer Using Perovskite Filter Arrays[J]. Laser & Optoelectronics Progress, 2024, 61(5): 0504002
    Download Citation