
Zhaomei Xu, Xiankai Meng, Yanrong Qu, Weiguo Zhu, Zhaoheng Guo. Process Parameter Optimization of Al2O3 Ceramics Milled with Nanosecond Pulsed Laser[J]. Laser & Optoelectronics Progress, 2019, 56(23): 231404
- Laser & Optoelectronics Progress
- Vol. 56, Issue 23, 231404 (2019)
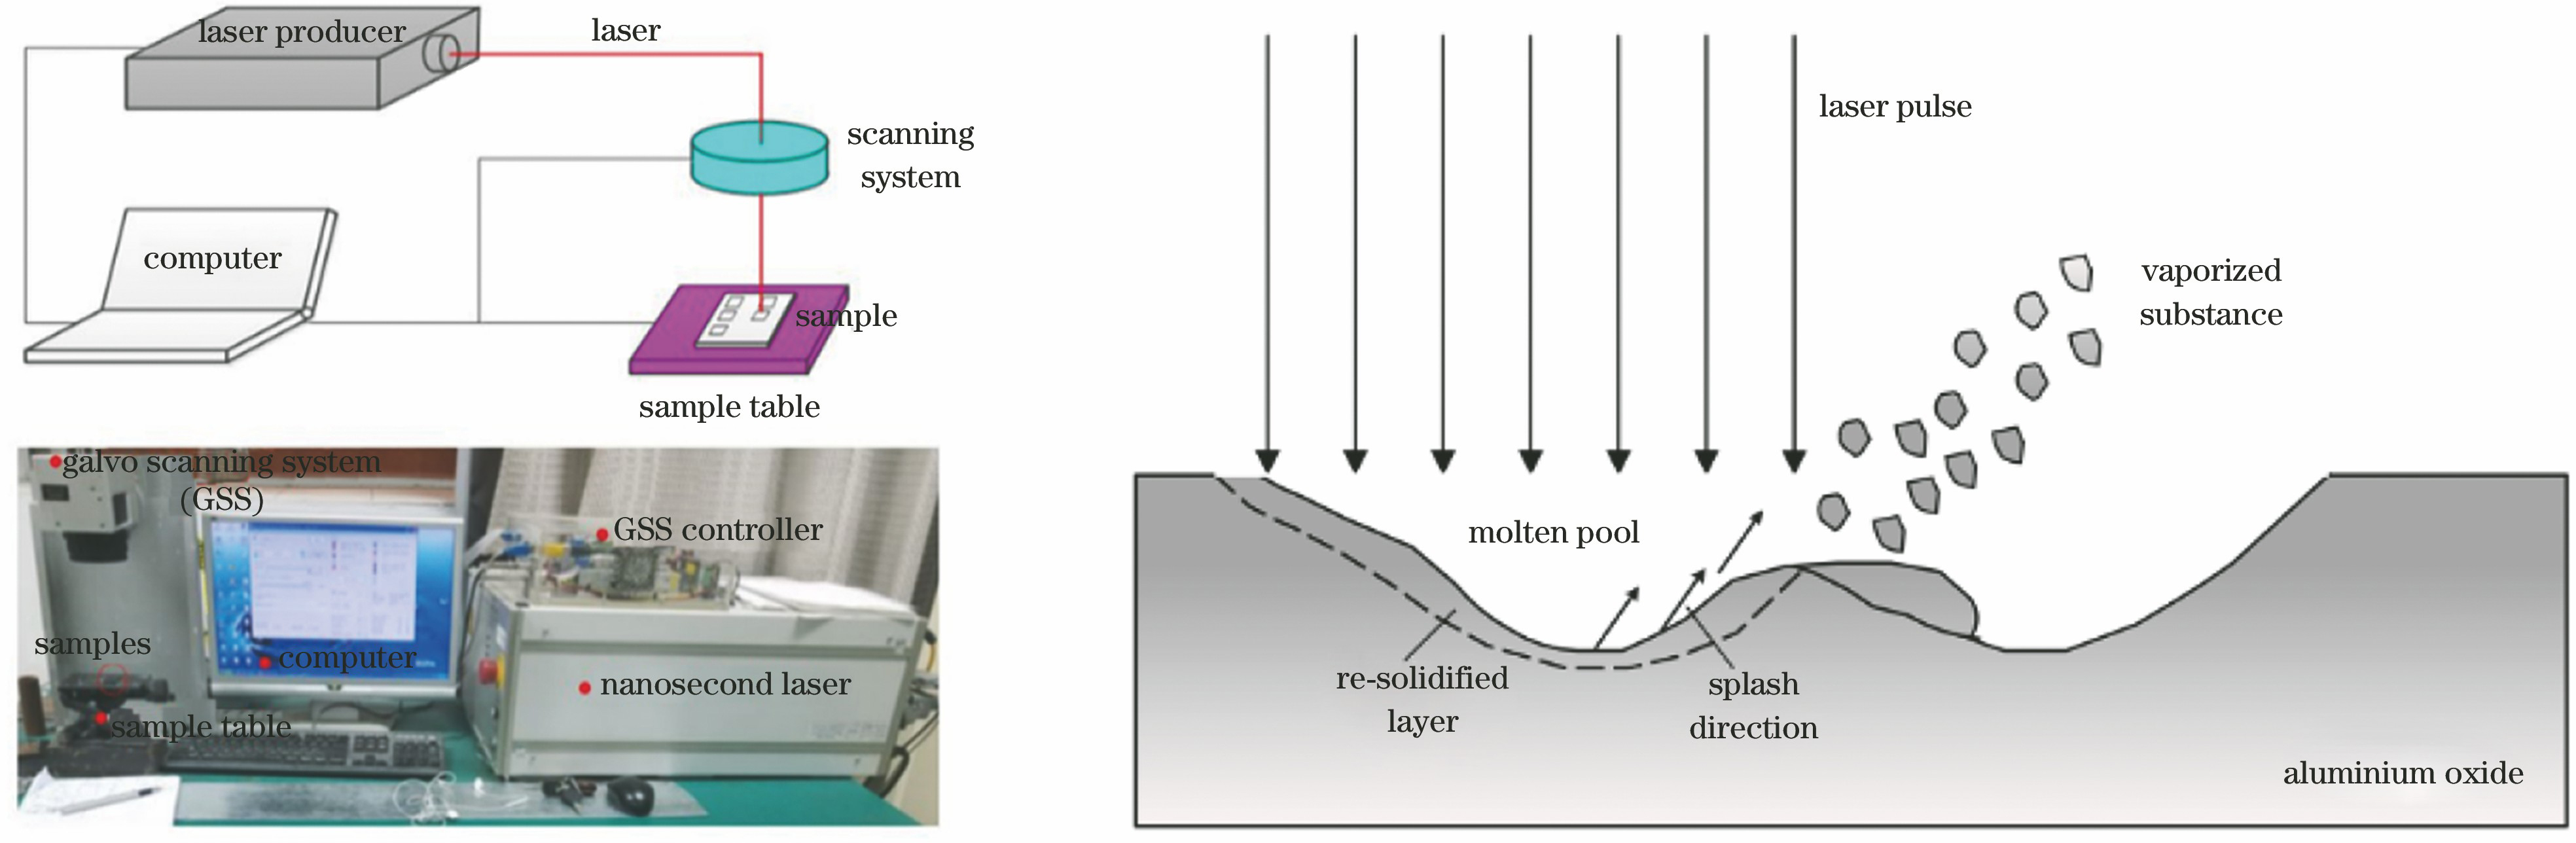
Fig. 1. Experimental system of laser milling and principle of laser milling. (a) Experimental system; (b) milling schematic
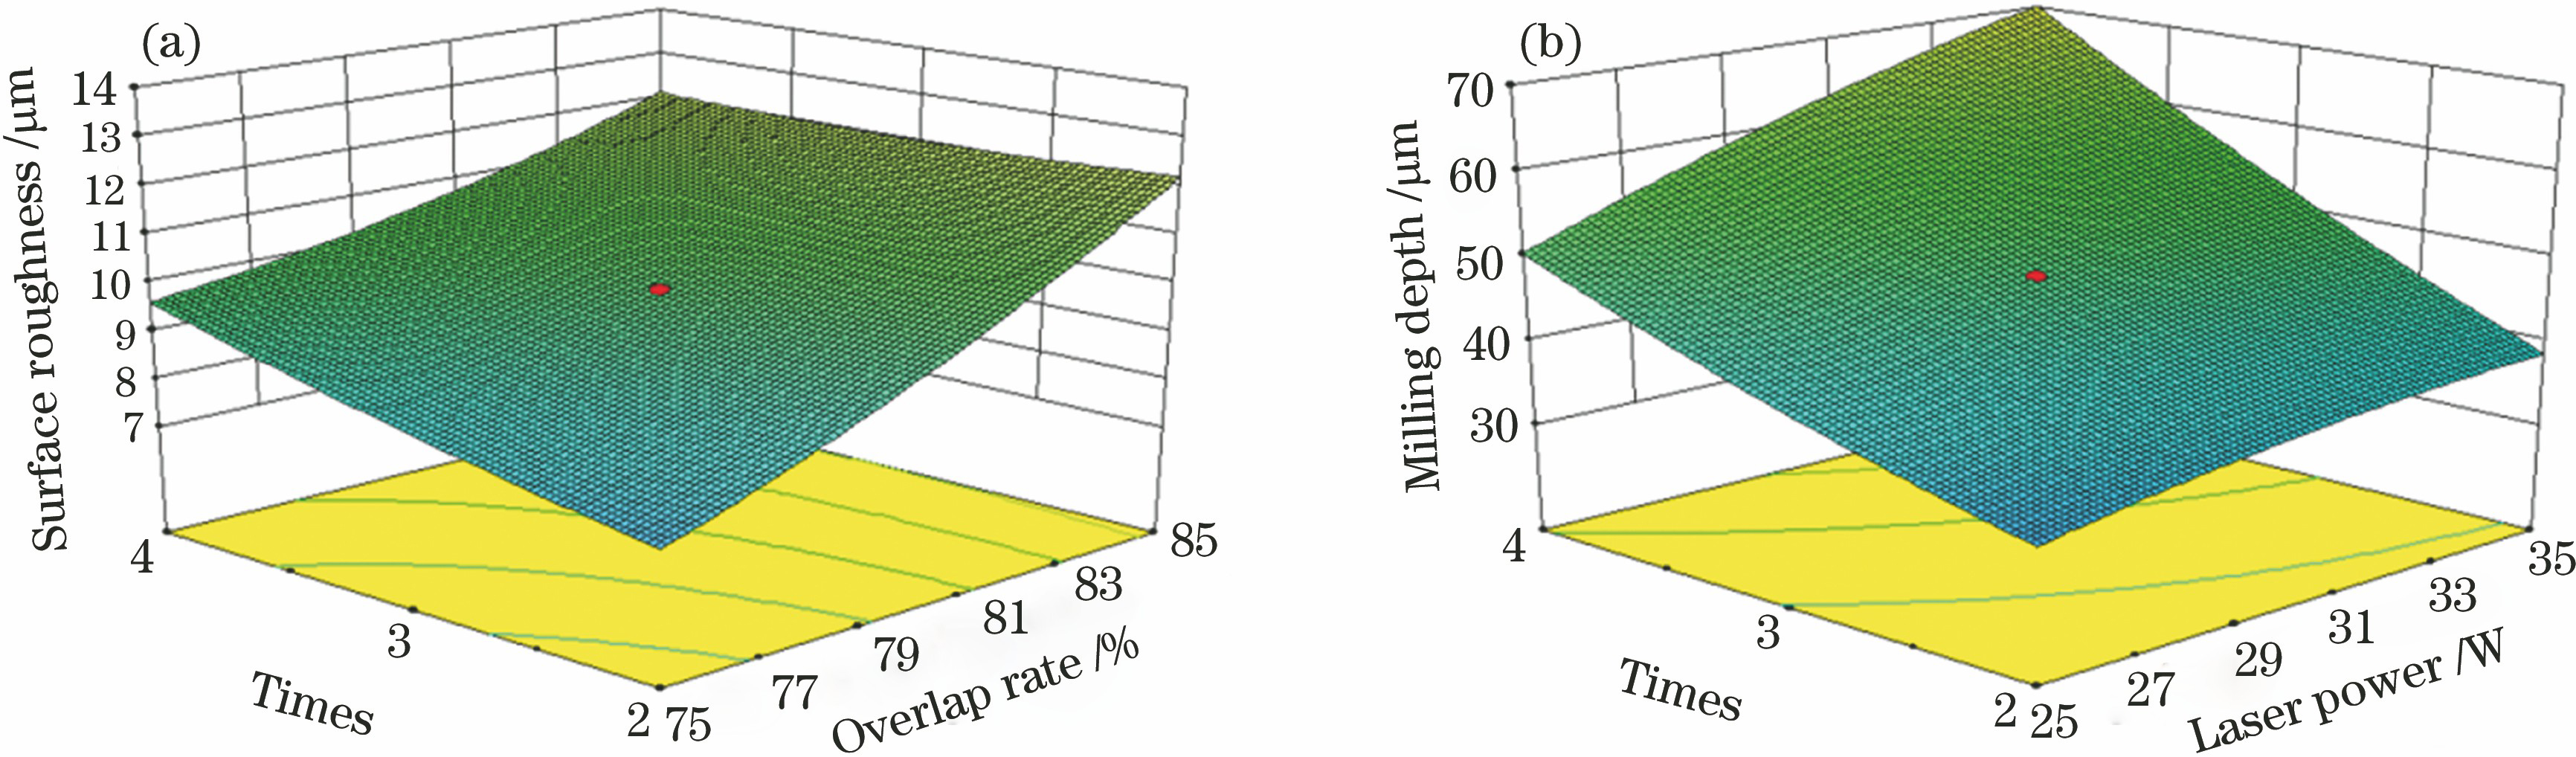
Fig. 2. Interactive effects of process parameters on milling quality. (a) Effect on surface roughness; (b) effect on milling depth
Fig. 3. Comparison of predicted and actual values. (a) Surface roughness; (b) milling depth
Fig. 4. Analysis results of sensitivity of overlap rate to milling quality (laser power is 30 W, milling times is 3, and laser repetition rate is 40 kHz)
Fig. 5. Analysis results of sensitivity of laser power to milling quality (overlap rate is 80%, milling times is 3, and laser frequency is 40 kHz)
Fig. 6. Analysis results of sensitivity of laser milling times to milling quality (overlap rate is 80%, laser power is 30 W, and laser repetition rate is 40 kHz)
Fig. 7. Analysis results of sensitivity of laser frequency to milling quality (overlap rate is 80%, laser power is 30 W, and milling times is 3)
Fig. 8. Results of multi-objective optimization
Fig. 9. Measurement area of surface roughness
Fig. 10. Three-dimensional topography and sectional profile after laser milling. (a) Three-dimensional topography; (b) sectional profile (overlap rate is 90%, laser power is 25.6 W, milling times is 5, and laser repetition rate is 50 kHz)
Fig. 11. Microstructures of ceramic surface before and after laser milling. (a) Initial surface and milled surface; (b) partial enlargement of initial surface; (c) partial enlargement of milled surface (overlap rate is 90%, laser power is 25.6 W, milling times is 5, and laser repetition rate is 50 kHz).
| |||||||||||||||||||||||||||||||||||||||||||||
Table 1. Process parameters and their value ranges
|
Table 2. Experimental design matrix and results
|
Table 3. Statistical evaluation of response surface model

Set citation alerts for the article
Please enter your email address
© Copyright 2018-2021 | Chinese Laser Press. All Rights Reserved 沪ICP备15018463号-20