
Chen YANG, Wei GUO, Zhi-Xian LI, Meng-Long JIAO, Zhi-Qiang ZHANG, Ji-Run LUO, Min ZHU. Design and experiments of a high-order body mode generator using quasi-optical technology[J]. Journal of Infrared and Millimeter Waves, 2021, 40(6): 768
- Journal of Infrared and Millimeter Waves
- Vol. 40, Issue 6, 768 (2021)
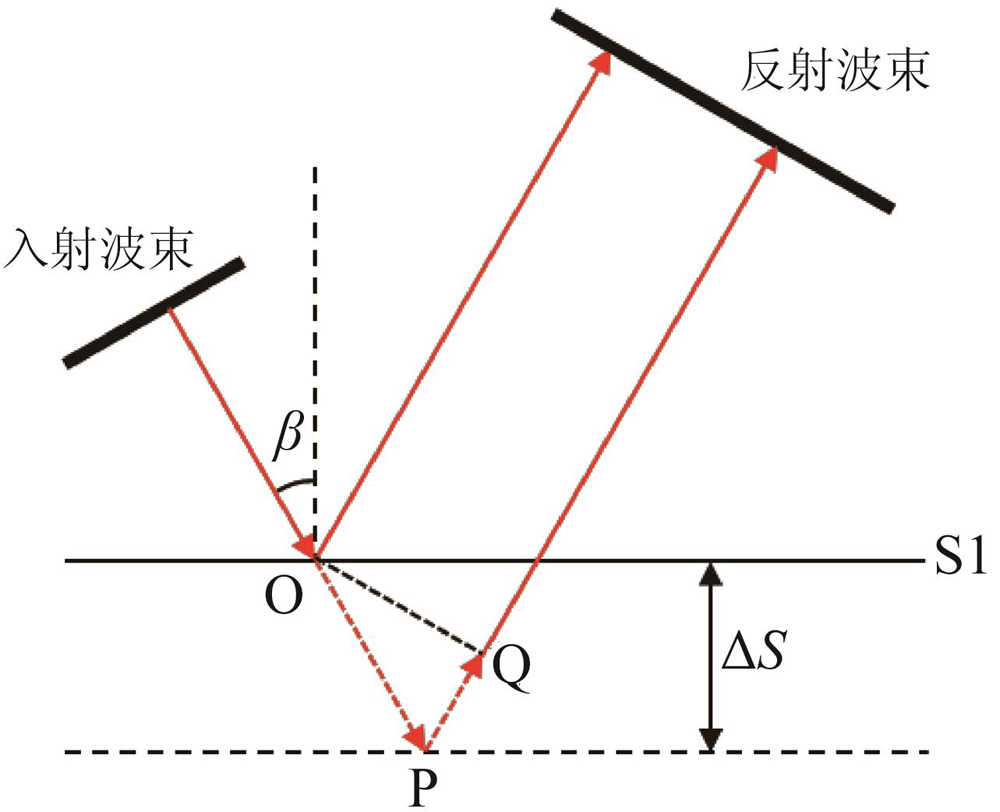
Fig. 1. Schematic diagram of phase correction by introducing optical path difference through perturbations on reflecting surface
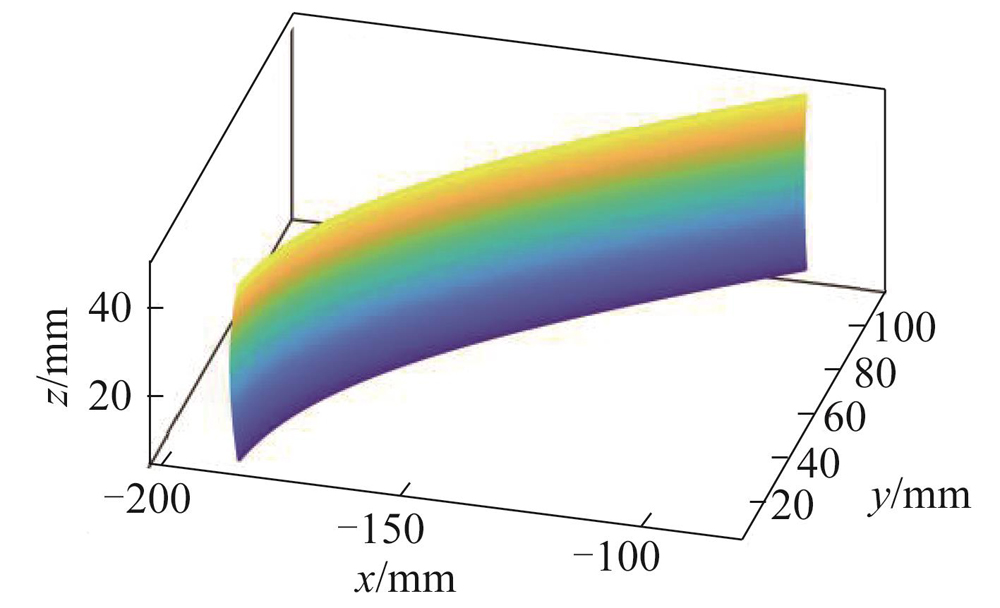
Fig. 2. Non-quadratic function contour for the phase correction mirror
Fig. 3. Field distribution of the reflected wave (a) normalized amplitude, (b) normalized phase
Fig. 4. Propagation process of wave entering the cavity and converging on a caustic surface
Fig. 5. The structure and geometric parameters of the open resonant cavity
Fig. 6. Cavity model of the mode generator
Fig. 7. Schematic diagram of quasi-optical mode generator system (a) overall model, (b) position relationship
Fig. 8. Comparison of the ideal field distribution and the simulation field distribution of TE28,8 mode (a) ideal electric field distribution, (b) simulation result of electric field distribution, (c) Ex component of ideal electric field distribution, (d) simulation result of Ex component of electric field distribution, (e) Ey component of ideal electric field distribution, (f) simulation result of Ey component of electric field distribution
Fig. 9. Picture of assembled quasi-optical mode generator
Fig. 10. Tested results of the field distribution on the cross section at 100 mm from the phase correction mirror (a) field amplitude distribution, (b) phase distribution
Fig. 11. Cold test system (a) overall block diagram, (b) photo of the test site
Fig. 12. Frequency test result of the mode generator
Fig. 13. Measurement of the resonant frequency and Q factor for the TE28,8 mode
Fig. 14. Measurements of the output field of quasi-optical mode generator (a) Electric field distribution of Excomponent, (b)eElectric field distribution of Ey component
Fig. 15. Phase distribution of Ex component
Fig. 16. Total electric field distribution in the cross section
|
Table 1. Excited modes and frequencies near to TE28,8 in the generator

Set citation alerts for the article
Please enter your email address
© Copyright 2018-2021 | Chinese Laser Press. All Rights Reserved 沪ICP备15018463号-20