Gaoyong Shi1、2、3, Ruifang Yang2、3、*, Nanjing Zhao2、3、**, Liangchen Liu1、2、3, Jinqiang Yang1、2、3, Peng Huang2、3、4, Gaofang Yin2、3, Li Fang2、3, and Wenqing Liu2、3
Author Affiliations
1College of Environmental Science and Optoelectronic Technology, University of Science and Technology of China, Hefei 230026, Anhui, China2Key Laboratory of Environmental Optics and Technology, Anhui Institute of Optics and Fine Mechanics, Hefei Institutes of Physical Science, Chinese Academy of Sciences, Hefei 230031, Anhui, China3Key Laboratory of Optical Monitoring Technology for Environment of Anhui Province, Hefei 230031, Anhui, China4School of Biology, Food and Environment, Hefei University, Hefei 230601, Anhui, Chinashow less
DOI: 10.3788/AOS221436
Cite this Article
Set citation alerts
Gaoyong Shi, Ruifang Yang, Nanjing Zhao, Liangchen Liu, Jinqiang Yang, Peng Huang, Gaofang Yin, Li Fang, Wenqing Liu. Rapid Detection Method of Total Amount of Aromatic Hydrocarbons in Soil Based on Fluorescence Imaging Technology[J]. Acta Optica Sinica, 2023, 43(6): 0612005
Copy Citation Text
show less
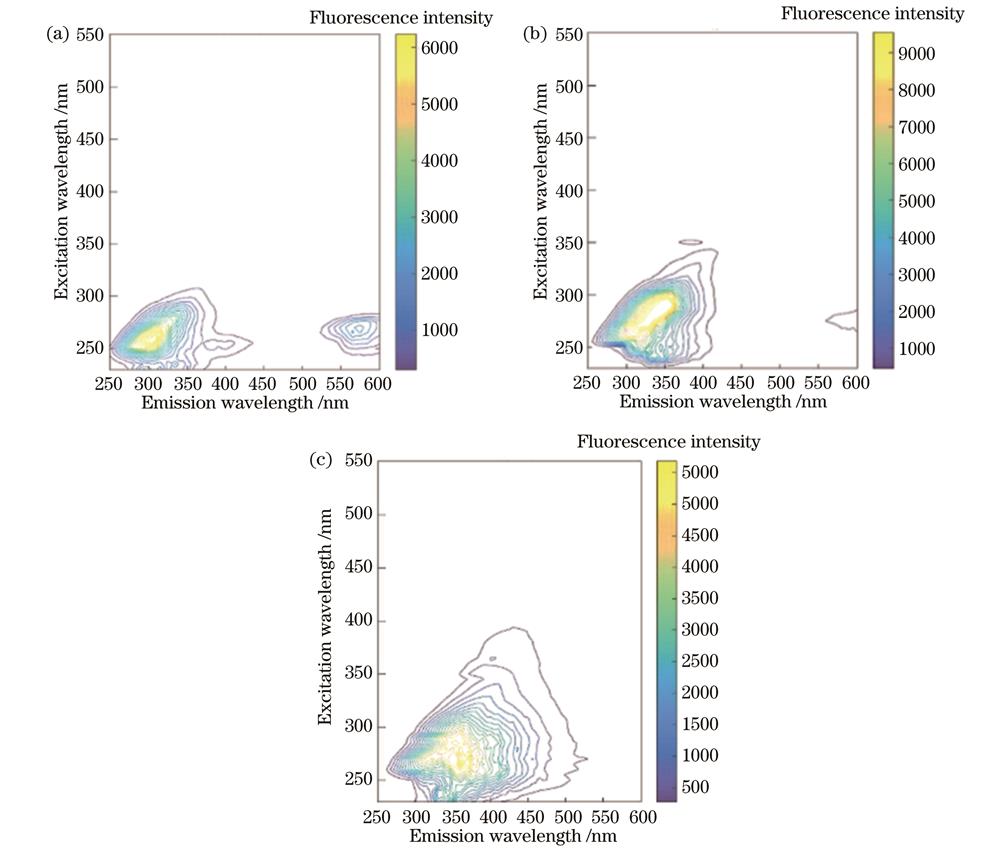
Fig. 1. Three-dimensional fluorescence spectra of oils. (a) Gasoline; (b) diesel fuel; (c) crude
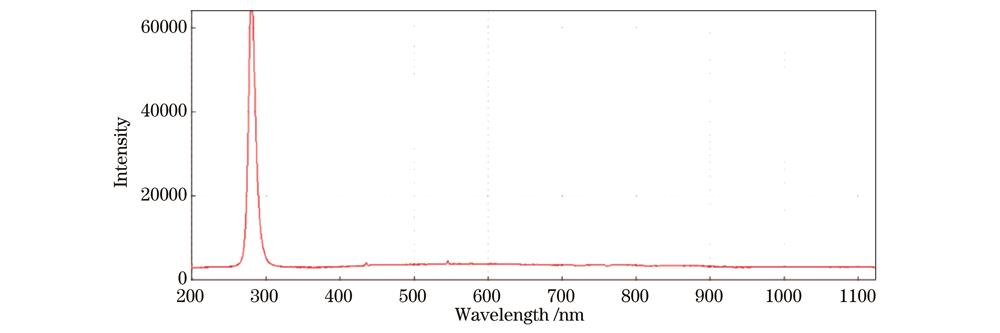
Fig. 2. Spectral curve of 280 nm ultraviolet light source
Fig. 3. Spectral response range curve of CCD camera
Fig. 4. Transmissivity of filter
Fig. 5. Schematic diagram of fluorescence detection system
Fig. 6. Physical picture of prepared soil sheet
Fig. 7. Experimental system
Fig. 8. Fluorescence image of blank soil sample
Fig. 9. Fluorescence images of calibrated samples
Fig. 10. Calibration curve
Fig. 11. Fluorescence images of tested samples
Fig. 12. Fluorescence value curve of test samples
| Mass fraction of oil in soil /% | Mass of soil with 5% oil /g | Blank /g | Mass fraction of oil in soil /% | Mass of soil with 5% oil /g | Blank /g | Mass fraction of oil in soil /% | Mass of soil with 5% oil /g | Blank /g |
|---|
| 0.1 | 0.2 | 9.8 | 1.0 | 2.0 | 8.0 | 1.9 | 3.8 | 6.2 | | 0.2 | 0.4 | 9.6 | 1.1 | 2.2 | 7.8 | 2.0 | 4.0 | 6.0 | | 0.3 | 0.6 | 9.4 | 1.2 | 2.4 | 7.6 | 2.1 | 4.2 | 5.8 | | 0.4 | 0.8 | 9.2 | 1.3 | 2.6 | 7.4 | 2.2 | 4.4 | 5.6 | | 0.5 | 1.0 | 9.0 | 1.4 | 2.8 | 7.2 | 2.3 | 4.6 | 5.4 | | 0.6 | 1.2 | 8.8 | 1.5 | 3.0 | 7.0 | 2.4 | 4.8 | 5.2 | | 0.7 | 1.4 | 8.6 | 1.6 | 3.2 | 6.8 | 2.5 | 5.0 | 5.0 | | 0.8 | 1.6 | 8.4 | 1.7 | 3.4 | 6.6 | | | | | 0.9 | 1.8 | 8.2 | 1.8 | 3.6 | 6.4 | | | |
|
Table 1. Preparation of samples containing different mass fractions of oil
| Test No. | Value | Test No. | Value | Test No. | Value | Test No. | Value |
|---|
| 1 | 100.322 | 6 | 100.435 | 11 | 100.456 | 16 | 100.363 | | 2 | 100.351 | 7 | 100.387 | 12 | 100.488 | 17 | 100.419 | | 3 | 100.406 | 8 | 100.483 | 13 | 100.447 | 18 | 100.534 | | 4 | 100.360 | 9 | 100.412 | 14 | 100.524 | 19 | 100.439 | | 5 | 100.328 | 10 | 100.432 | 15 | 100.461 | 20 | 100.373 |
|
Table 2. Results of 20 blank sample tests
| Mass fraction /% | 0.20 | 0.30 | 0.40 | 0.50 | 0.70 | 0.80 | 0.90 | 1.00 | 1.10 | 1.20 |
|---|
| 1 s | 103.591 | 106.261 | 106.766 | 108.372 | 111.059 | 116.711 | 120.969 | 122.033 | 126.043 | 124.553 | | 2 s | 103.513 | 106.032 | 106.805 | 107.786 | 110.792 | 115.417 | 119.132 | 121.410 | 123.827 | 124.182 | | 3 s | 103.555 | 105.84 | 106.819 | 106.683 | 110.701 | 114.259 | 119.451 | 120.236 | 122.073 | 123.595 | | 4 s | 103.478 | 105.596 | 106.737 | 106.449 | 110.478 | 113.839 | 116.119 | 119.765 | 120.593 | 122.460 | | 5 s | 103.484 | 104.688 | 106.837 | 106.314 | 110.401 | 113.659 | 115.624 | 119.462 | 120.015 | 121.861 | | Average | 103.524 | 105.683 | 106.793 | 107.121 | 110.686 | 114.777 | 118.259 | 120.581 | 122.510 | 123.330 | | Mass fraction /% | 1.30 | 1.40 | 1.60 | 1.70 | 1.80 | 2.00 | 2.10 | 2.20 | 2.30 | 2.40 | | 1 s | 132.123 | 131.146 | 132.636 | 138.967 | 139.740 | 146.028 | 149.549 | 150.750 | 153.684 | 155.712 | | 2 s | 127.331 | 127.694 | 131.352 | 136.203 | 138.981 | 144.371 | 146.727 | 149.326 | 150.496 | 153.831 | | 3 s | 124.318 | 126.584 | 130.977 | 134.475 | 137.335 | 143.198 | 144.942 | 147.746 | 148.372 | 152.236 | | 4 s | 122.491 | 124.013 | 130.671 | 132.904 | 135.867 | 141.501 | 142.985 | 146.318 | 146.583 | 150.487 | | 5 s | 120.811 | 122.672 | 129.552 | 131.375 | 134.441 | 141.023 | 141.295 | 145.762 | 144.741 | 149.098 | | Average | 125.415 | 126.422 | 131.038 | 134.785 | 137.273 | 143.224 | 145.099 | 147.980 | 148.775 | 152.273 |
|
Table 3. Mean fluorescence values of test samples
| Mass fraction / | Mean fluorescence | Inversion / | Deviation /% | Mass fraction / | Mean fluorescence | Inversion / | Deviation /% |
|---|
| 2000 | 103.524 | 2950 | 47.728 | 13000 | 125.415 | 12830 | 1.275 | | 3000 | 105.683 | 3930 | 30.961 | 14000 | 126.422 | 13290 | 5.081 | | 4000 | 106.793 | 4430 | 10.740 | 16000 | 131.038 | 15370 | 3.925 | | 5000 | 107.121 | 4580 | 8.448 | 17000 | 134.785 | 17060 | 0.371 | | 7000 | 110.686 | 6190 | 11.617 | 18000 | 137.273 | 18190 | 1.033 | | 8000 | 114.777 | 8030 | 0.413 | 20000 | 143.224 | 20230 | 4.360 | | 9000 | 118.259 | 9600 | 6.718 | 21000 | 145.099 | 20870 | 3.420 | | 10000 | 120.581 | 10650 | 6.527 | 22000 | 147.980 | 21720 | 4.630 | | 11000 | 122.510 | 11520 | 4.758 | 23000 | 148.775 | 23020 | 1.640 | | 12000 | 123.330 | 11890 | 0.888 | 24000 | 152.273 | 23380 | 3.983 |
|
Table 4. Inversion mass fractions and deviations of test samples