
Yang CAO, Zupeng ZHANG, Xiaofeng PENG. Wavefront Distortion Restoration Method Based on Residual Attention Network[J]. Acta Photonica Sinica, 2022, 51(12): 1206002
- Acta Photonica Sinica
- Vol. 51, Issue 12, 1206002 (2022)
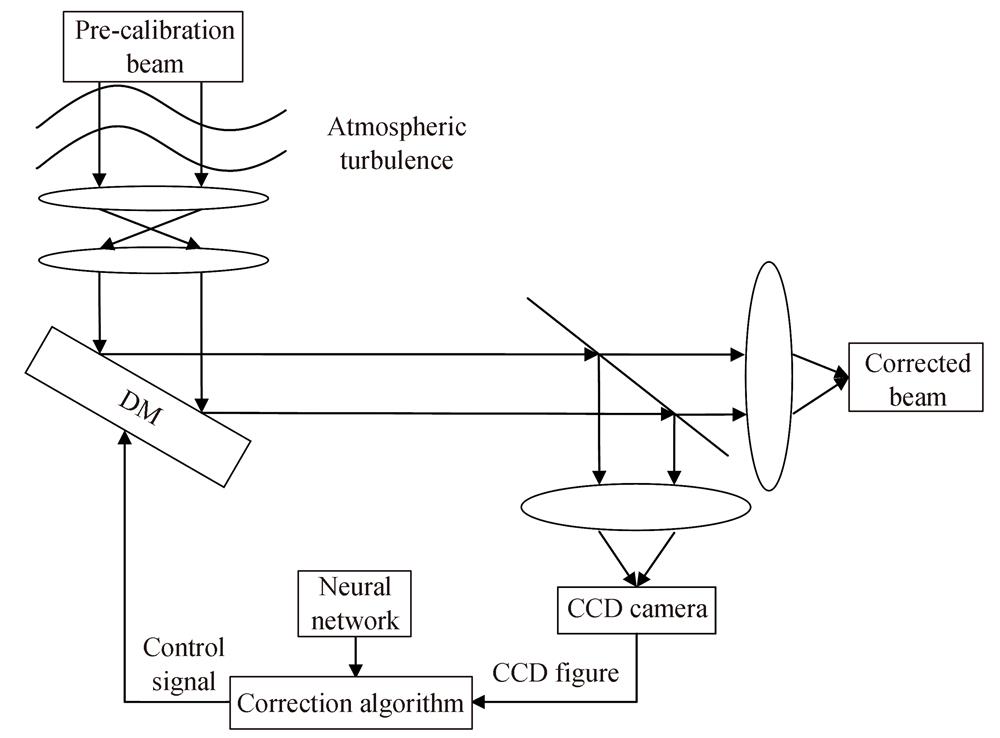
Fig. 1. Schematic diagram of AO system without wavefront detection
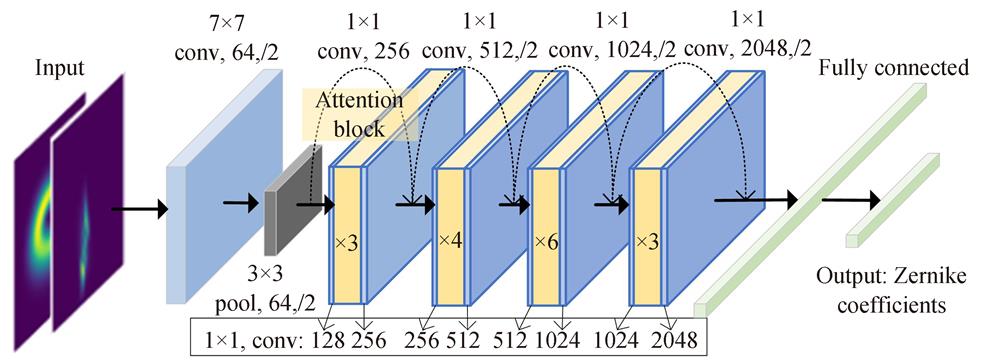
Fig. 2. Overall network structure
Fig. 3. Structure diagram of mixed attention
Fig. 4. Turbulent phase distribution and light intensity distribution
Fig. 5. Loss function and accuracy of the model
Fig. 6. Comparison of the predicted turbulence phase with the actual phase
Fig. 7. Comparison of the predicted Zernike coefficient with the actual coefficient
Fig. 8. Light intensity map at different SNR
Fig. 9. Residual phase at different SNR
Fig. 10. Comparison of prediction results between the model with partial attention mechanism removed and the complete model
Fig. 11. Comparison of partial loss function with complete model
|
Table 1. Parameter of simulation
| ||||||||||||||||||||||||||||||||||||||||||||
Table 2. PV and RMS values of the residual phase at different turbulence intensities
| |||||||||||||||||||||||||||||||||||||||||||||||||||||||
Table 3. PV and RMS values of the residual phase at different SNR
|
Table 4. Comparison of accuracy and calculation time of different models
|
Table 5. Comparison of evaluation indexes of removing partial attention mechanism
|
Table 6. Comparison of evaluation indexes of partial loss function

Set citation alerts for the article
Please enter your email address
© Copyright 2018-2021 | Chinese Laser Press. All Rights Reserved 沪ICP备15018463号-20