
Da-Yong Wang, Bing Li, Lu Rong, Jie Zhao, Yun-Xin Wang, Chang-Chao Zhai. Continuous-wave terahertz quantitative dual-plane ptychography [J]. Acta Physica Sinica, 2020, 69(2): 028701-1
- Acta Physica Sinica
- Vol. 69, Issue 2, 028701-1 (2020)
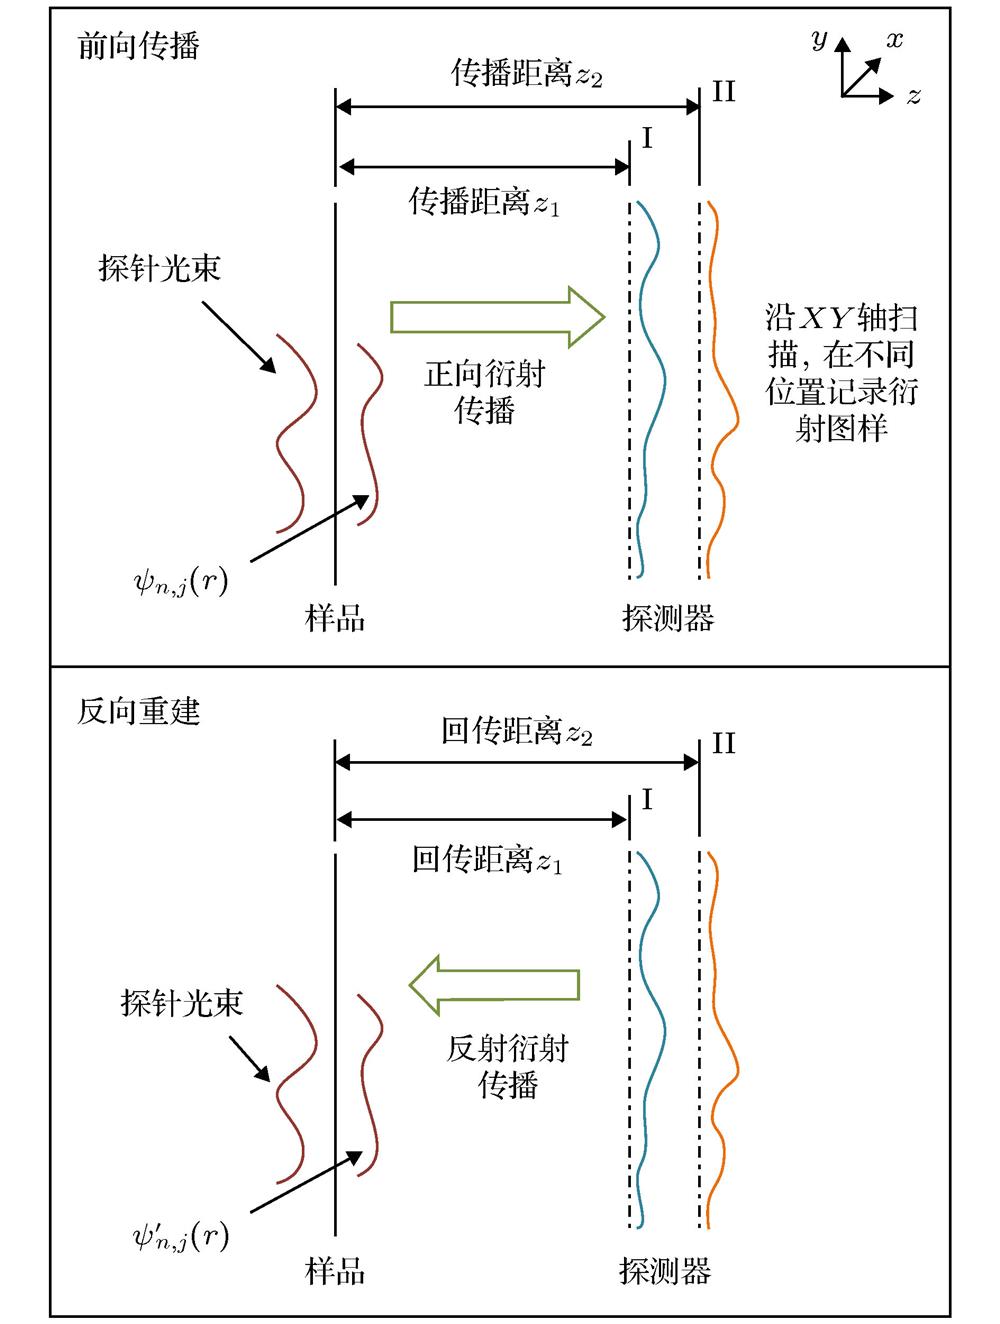
Fig. 1. Schematic diagram of dual plane ptychographic imaging.双物距叠层成像的原理图
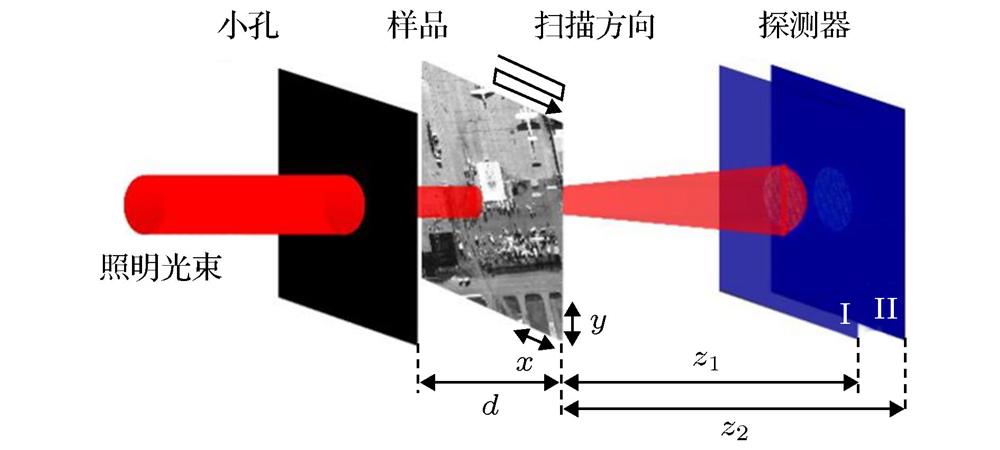
Fig. 2. Schematic diagram of the terahertz dual-plane ptychographic simulation.仿真实验原理图
Fig. 3. Sample for ptychographic simulation: (a) Input amplitude distribution; (b) input phase distribution.仿真实验中的样品 (a) 振幅分布, (b) 相位分布
Fig. 4. Convergence of the ePIE and dp-ePIE algorithms.收敛度评价曲线
Fig. 5. Comparison of simulation results with ePIE and dp-ePIE: (a1) and (b1), (c1) and (d1), (e1) and (f1) are the amplitude and phase reconstruction with ePIE algorithm; (a2) and (b2), (c2) and (d2), (e2) and (f2) are the amplitude and phase reconstruction with dp-ePIE algorithm.叠层仿真重建结果 (a1)、(b1), (c1)、(d1)和(e1)、(f1)分别表示ePIE算法迭代4次、20次及50次迭代重建振幅分布与相位分布; (a2)、(b2), (c2)、(d2)和(e2)、(f2)分别表示dp-ePIE算法迭代4次、20次及50次迭代重建振幅分布与相位分布
Fig. 6. Comparison of correlation coefficients of reconstruction results: (a) Comparison of correlation coefficients of amplitude reconstruction results with dp-ePIE and ePIE; (b) comparison of correlation coefficients of phase reconstruction results with dp-ePIE and ePIE.重建结果的相关系数比较 (a) dp-ePIE与ePIE算法幅值重建结果与迭代次数关系; (b) dp-ePIE与ePIE算法相位重建结果与迭代次数关系
Fig. 7. Relation between correlation coefficients of reconstruction image and different recording intervals.重建像相关系数与探测器采集位置间隔距离关系曲线
Fig. 8. Setup of continuous-wave terahertz dual-plane ptychography.连续太赫兹波叠层成像实验装置示意图
Fig. 9. Sample of recyclable polypropylene triangle pattern: (a) Model of the sample; (b) picture of the sample.聚丙烯可回收三角标志图案样品 (a)三角标志模型; (b)样品实物图
Fig. 10. The reconstructed results after 10 iterations by two different reconstruction algorithms: (a1), (b1) Represent the amplitude and phase reconstructed based on ePIE algorithm: (a2), (b2) represent the amplitude and phase reconstructed based dp-ePIE algorithm.两种叠层重建算法分别迭代10次后可回收标志的重建结果 (a1), (b1)分别表示ePIE算法重建振幅分布及相位分布; (a2), (b2)表示dp-ePIE算法重建振幅分布及相位分布

Set citation alerts for the article
Please enter your email address
© Copyright 2018-2021 | Chinese Laser Press. All Rights Reserved 沪ICP备15018463号-20