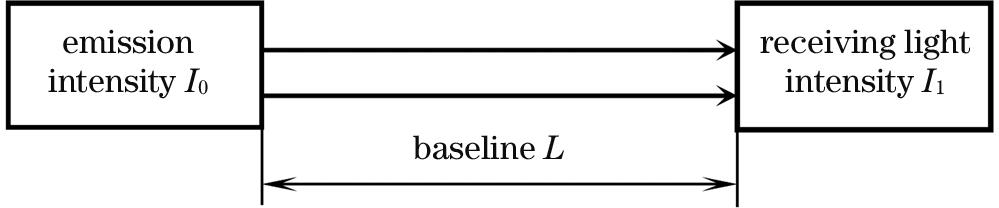
Objective Visibility measurement is not only used for weather forecasting but also widely used in aviation, voyage, highway, military, and environmental monitoring. In the visibility observation, the instrument measurement replaces manual observation. Currently, the mature visibility measuring instruments have transmission-and scattering-types. Advantage of the transmission type is that it can detect atmospheric transmittance without any assumptions about the atmospheric conditions. Owing to the large sampling volume and high accuracy, the transmission visibility meter is widely used in airports. Since several years, the World Meteorological Organization has been conducting a tracking study on measurement errors of visibility meters distributed globally. The results showed that the main reason for measurement uncertainties is the incorrect alignment of the transmitter and receiver. Errors caused by this incorrect alignment can be attributed to spot drift, which is projected by the detection beam on the sensitive area of the detector. In this paper, the influences of photodiode on the uncertainty of the visibility measurement were reported, law of the influence of spot drift on transmission visibility measurement uncertainty was found, and strategies to suppress the effects of beam drift were presented.
Methods The photodiode spectral response distribution equation was derived based on the quantum conversion efficiency. In transmission visibility meters, photodiodes with large sensitive areas are the most general choice because of their full energy utilization. However, the size of a sensitive area has its limitations; the spectral response on the sensitive area is not distributed uniformly because the edge of the sensitive area is the recombination center of photogenerated carriers, which implies that the output current of the photodiode is different when light spot with the same power beam drifts at different positions. An experimental visibility receiver setup for verification was constructed, and two photodiodes made by different manufacturers were selected. Their nominal sensitive surface area was 6.0 mm×6.0 mm, and diameter of the light spot projected on the sensitive surface was approximately 0.3 mm. A micrometer was used to determine the position of the light spot on the sensitive area, and a low-noise I/V circuit was proposed to detect the output current of the photodiodes. The I/V circuit output voltage could be acquired by a high-precision digital voltmeter. To reduce the influence of the laser output changes, a standard laser power meter was used to monitor the laser output power during the experiment. In the experiment, the light spot was always located in a sensitive area. The spectral response distributions of the two photodiodes were measured separately, and the contribution of voltage offset error to the uncertainty of visibility measurement was derived according to Koschmieder's law.
Results and Discussions Two types of photodiodes, UV-0 **DQ and 2CU **, were measured. Center of the detector's sensitive area is taken as the reference point, and the effective value of the output voltage of the preamplifier is varied with the position of the light spot (Fig.3). The diameter of the spot was 1/20 of the side length of the sensitive area, which satisfied the condition that the light spot is small enough (Eq.14). According to the measured effective value of output voltage U and laser power, the spectral responsivity Rλ distribution of two photodiodes was calculated (Fig.4), and the relationship between relative deviation of the two photodetectors relative to the center responsivity and displacement of the light spot was obtained (Fig.5). The least-squares method was used to fit the changes of the output voltage and responsivity with the displacement using a quadratic polynomial. Based on the fitting equation, the relative deviation of the voltage relative to the voltage of the spot at the center was calculated when the spot drift left the center position (Fig.6). When the visibility was 2 and 10 km and baseline was 70 and 30 m, the contribution of the spot drift of the beam on the sensitive area, which is relative to the center of the detector, to the relative uncertainty of the visibility measurement was obtained (Tables 1 and 2). Measurements and calculations showed that the center of the sensitive area has the highest spectral responsivity, and the farther away from the center, the smaller the spectral responsivity acquired. Within a certain range of the center region, the spectral responsivity is relatively uniform. Therefore, when the spot drift of the beam is limited to this region, the contribution of the scale effect of photodiodes to the measurement uncertainty of visibility can be ignored.
Conclusions Owing to the limitations of the sensitive area of the photodiode, the edge of the sensitive area is the recombination center of the photogenerated carriers. The region closer to the edge has a greater probability of carriers' recombination, and the quantum efficiency near the edge is minimized. Although the probability of the carriers' recombination in the center of the sensitive area is the least, the quantum efficiency in this area is the highest. Consequently, the responsivity of photoelectric conversion in different sensitive areas varies, and its distribution curve is approximately parabolic. The uniformity of photodiode photoelectric conversion has the optimal value in the center area. Therefore, for the detection system that does not require high accuracy, more accurate measurements can be achieved provided the light spot is located at the center area of the photodiode. For the visibility meter, the scale effect of photodiode has a significant impact on the uncertainty of the measurement. When designing a transmission-type visibility detection system, it is necessary to select a photodiode with a minimized scale effect. It is equally important to optimize the optical parameters of the receiver to ensure that the light spot projected on the sensitive area is small enough and center of the light spot is always located in a small area near the center of the sensitive area. A uniform beam can also be used to overlay the sensitive area of a detector to effectively suppress the contribution of the scale effect to the measurement uncertainty.