
Yunxiang Zhang, Xin Li, Dong Huang, Yanna Zhang, Wei Wei, Yan Pan. Opto-mechanical design and performance test of infrared channel field radiometer[J]. Infrared and Laser Engineering, 2022, 51(12): 20220246
- Infrared and Laser Engineering
- Vol. 51, Issue 12, 20220246 (2022)
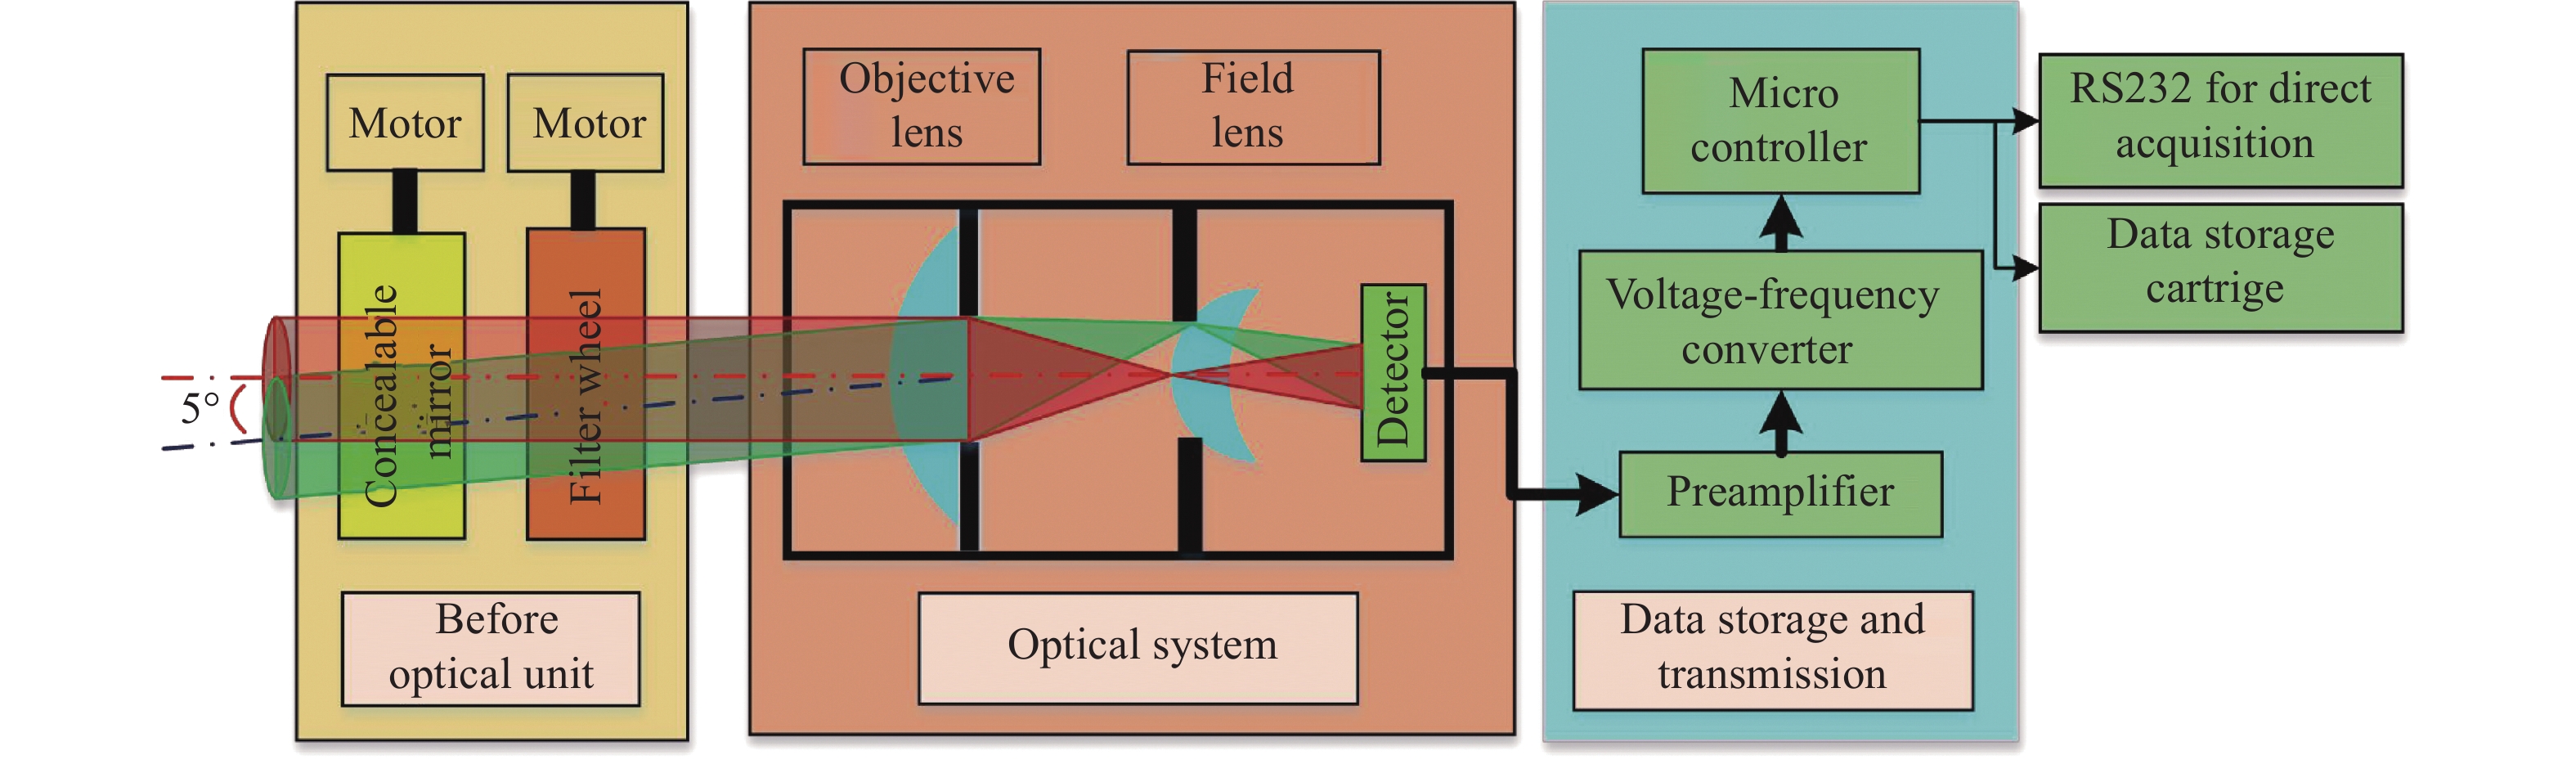
Fig. 1. Schematic of ICFR
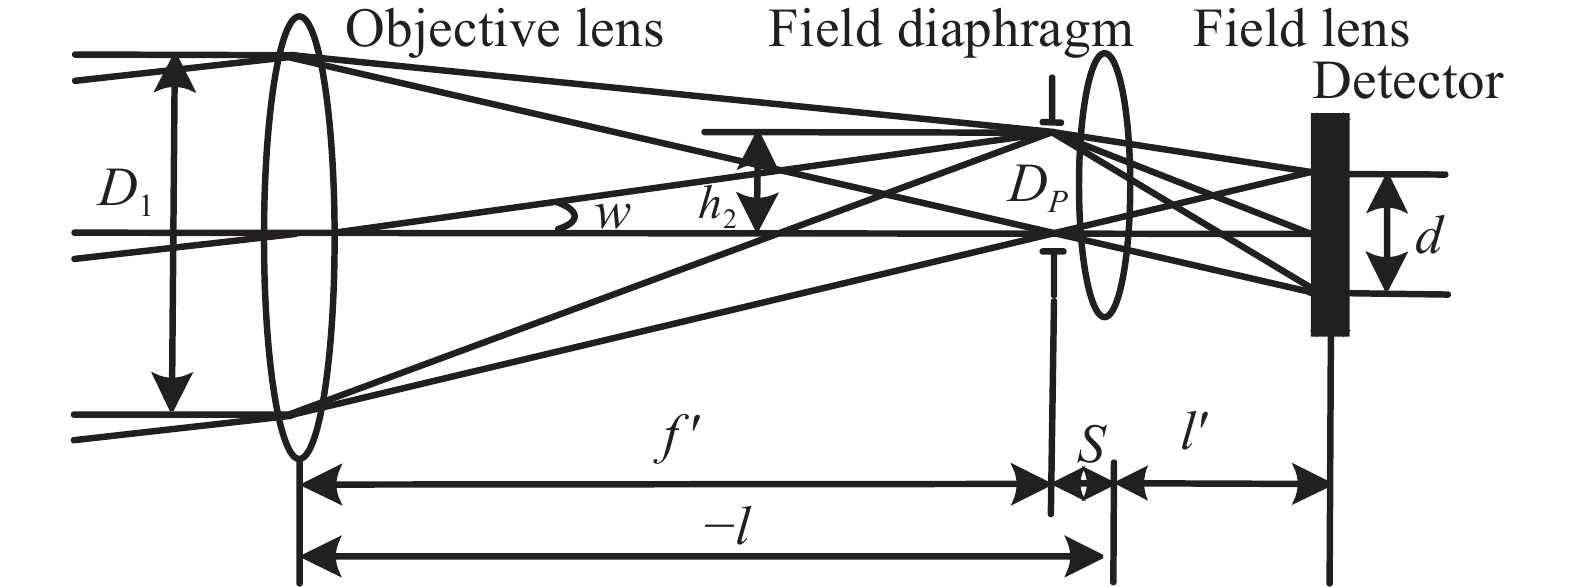
Fig. 2. Schematic diagram of combined optical path
Fig. 3. Optical system of ICFR
Fig. 4. Diffuse spots of optical system of ICFR
Fig. 5. Schematic diagram of ICFR optical head structure
Fig. 6. Light barrel structure diagram of ICFR
Fig. 7. Radiance calibration curve of the ICFR four channels
Fig. 8. Schematic diagram of thermal shock resistance measuring device
Fig. 9. Temperature setting of Peltier
Fig. 10. Difference between ICRF measured blackbody temperature and set temperature under thermal shock
Fig. 11. Working environment temperature suitability test device of ICFR
Fig. 12. Result of ICFR measures the brightness temperature of the reference plate and Platinum resistance measures the physical temperature of the reference plate
Fig. 13. Field comparison experiment
Fig. 14. Comparison of the surface brightness temperature data obtained by the corresponding channels of ICFR and CE312
|
Table 1. Technical indicators of ICFR
|
Table 2. Lens characteristics of ICFR
|
Table 3. Characteristics of ST60 TO-5
|
Table 4. Performance parameters of CES100-06 blackbody
|
Table 5. Values of the parameters fitting the ICFR channels
|
Table 6. Combined uncertain of radiometric calibration
|
Table 7. Analysis of the mean value and standard deviation of the brightness temperature of the ground surface measured by ICFR and CE312

Set citation alerts for the article
Please enter your email address
© Copyright 2018-2021 | Chinese Laser Press. All Rights Reserved 沪ICP备15018463号-20