
Mingjun Wang, Wenhui Yu, Chaojun Huang. Transmission Characteristics of Underwater Laguerre-Gaussian Vortex Beam and Its Superposition States[J]. Acta Optica Sinica, 2023, 43(6): 0626001
- Acta Optica Sinica
- Vol. 43, Issue 6, 0626001 (2023)
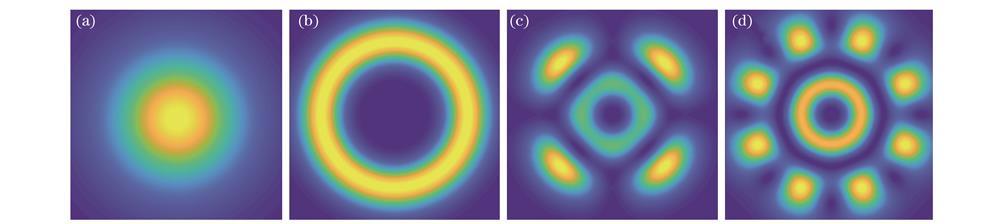
Fig. 1. Simulation results of light intensity distribution of four beams. (a) Gaussian beam; (b) LG vortex beam; (c) vortex light superposition state 1; (d) vortex light superposition state 2
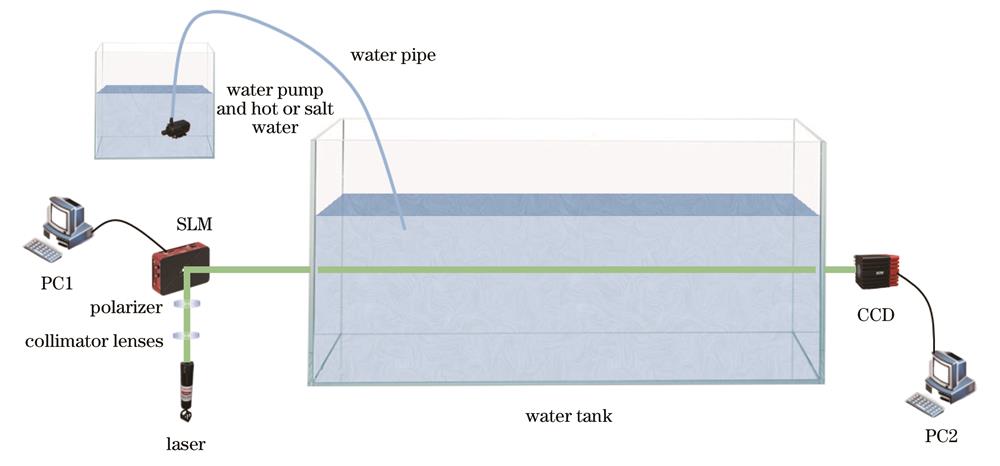
Fig. 2. Schematic of the experiment for simulating underwater turbulence environment
Fig. 3. Spot diagrams of four beams passing through turbulent flow with different intensities
Fig. 4. Beam drift of four beams after passing through turbulent flow of different intensities
Fig. 5. Beam drift variance of four beams passing through turbulent flow with different intensities. (a) Different temperature differences; (b) different salinity differences
Fig. 6. Power jitter of an LG vortex beam with order 0 and topological charge 6 after passing through turbulent flow with different intensities. (a) No turbulent flow; (b) 10 ℃ temperature difference; (c) 2‰ salinity difference
Fig. 7. Scintillation indices of four beams after passing through turbulent flow caused by different temperature differences in multiple experiments. (a) Gaussian beam; (b) LG vortex beam; (c) vortex light superposition state 1; (d) vortex light superposition state 2
Fig. 8. Scintillation indices of four beams passing through turbulent flow caused by different temperature differences
Fig. 9. Scintillation indices of four beams after passing through turbulent flow caused by different salinity differences in multiple experiments. (a) Gaussian beam; (b) LG vortex beam; (c) vortex light superposition state 1; (d) vortex light superposition state 2
Fig. 10. Scintillation indices of four beams passing through turbulent flow caused by different salinity differences

Set citation alerts for the article
Please enter your email address
© Copyright 2018-2021 | Chinese Laser Press. All Rights Reserved 沪ICP备15018463号-20