• Photonics Research
  • Vol. 9, Issue 4, B87 (2021)
George Sarantoglou1、3, Menelaos Skontranis1, Adonis Bogris2, and Charis Mesaritakis1、*
Author Affiliations
  • 1Department of Information and Communication Systems Engineering, University of the Aegean, Palama 2, Karlovassi 83200 Samos, Greece
  • 2Department of Informatics and Computer Engineering, University of West Attica, Aghiou Spiridonos, 12243 Egaleo, Athens, Greece
  • 3e-mail: gsarantoglou@aegean.gr
  • show less
    DOI: 10.1364/PRJ.413371 Cite this Article Set citation alerts
    George Sarantoglou, Menelaos Skontranis, Adonis Bogris, Charis Mesaritakis. Experimental study of neuromorphic node based on a multiwaveband emitting two-section quantum dot laser[J]. Photonics Research, 2021, 9(4): B87 Copy Citation Text show less
    Experimental setup. ML, master laser; SL, slave laser; VOA, variable optical attenuator; PC, polarization controller; OC, optical circulator; FC, fiber coupler; OSA, optical spectrum analyzer; GSF, ground-state passband filter; PD, photodiode; and OSCI, oscilloscope. The dashed box contains the first experiment (Part I), which was based on the electro-optic triggering of the SL through current injection, whereas the full line box contains the full unidirectional optical injection setup (Part II).
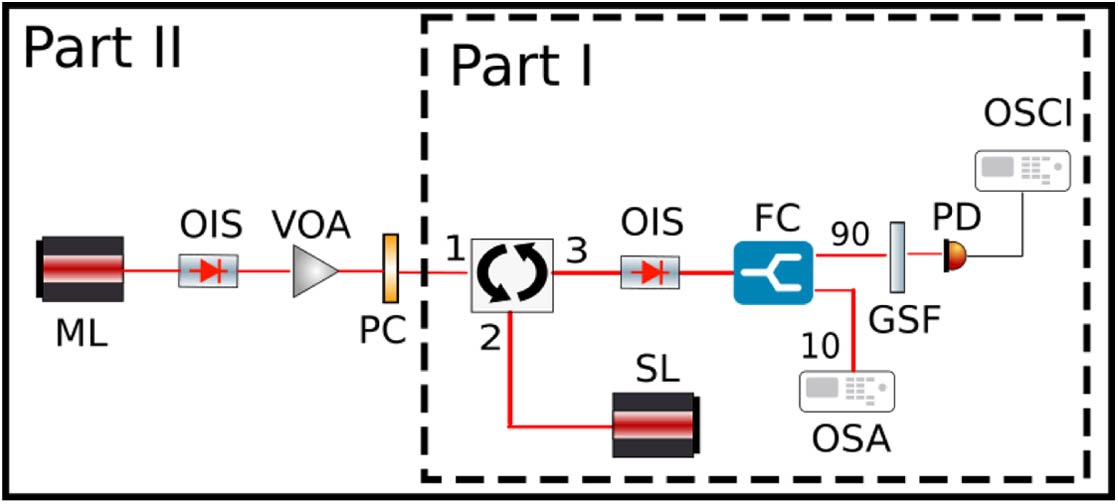
    Fig. 1. Experimental setup. ML, master laser; SL, slave laser; VOA, variable optical attenuator; PC, polarization controller; OC, optical circulator; FC, fiber coupler; OSA, optical spectrum analyzer; GSF, ground-state passband filter; PD, photodiode; and OSCI, oscilloscope. The dashed box contains the first experiment (Part I), which was based on the electro-optic triggering of the SL through current injection, whereas the full line box contains the full unidirectional optical injection setup (Part II).
    (a) GS optical power of the QD SL, for various gain current and SA reverse voltage bias conditions; (b) ES optical power of the QD SL, for various gain current and SA reverse voltage bias conditions. The white regions refer to corrupt measurements, which, however, correspond to bias regimes that are not related to the neurocomputational properties of the SL.
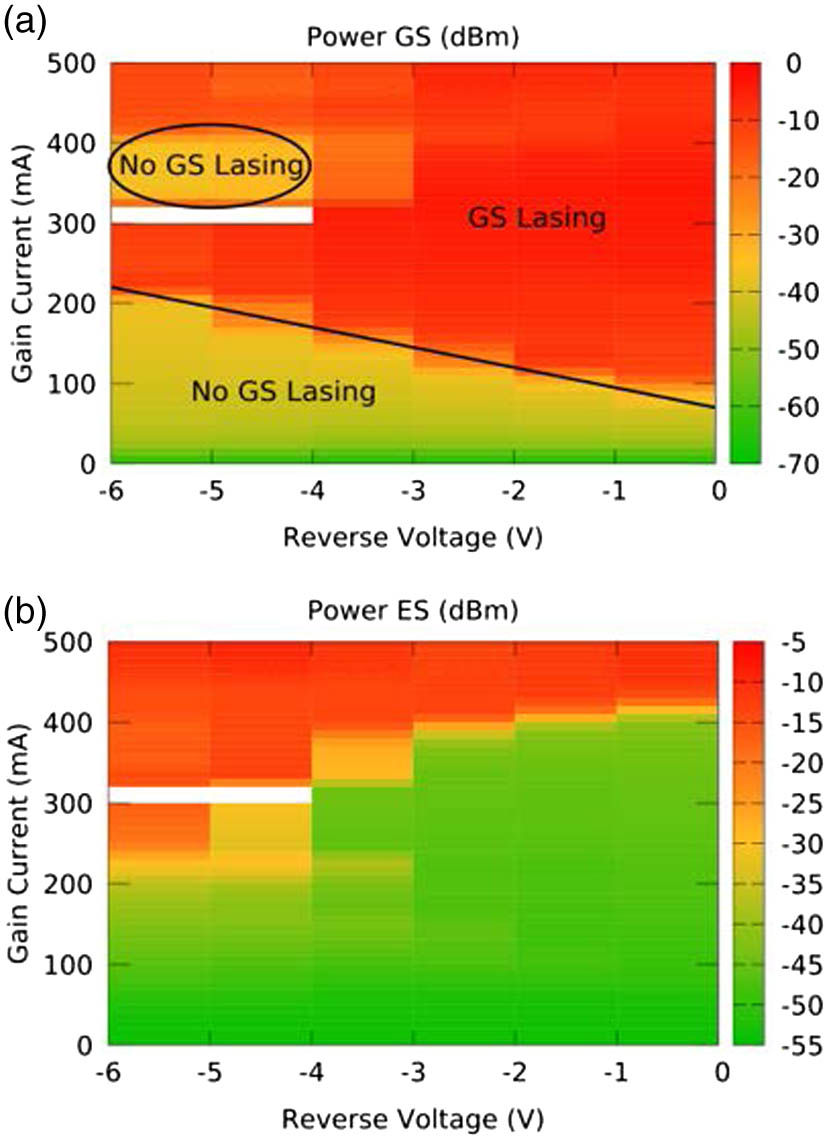
    Fig. 2. (a) GS optical power of the QD SL, for various gain current and SA reverse voltage bias conditions; (b) ES optical power of the QD SL, for various gain current and SA reverse voltage bias conditions. The white regions refer to corrupt measurements, which, however, correspond to bias regimes that are not related to the neurocomputational properties of the SL.
    Development of (a) GS and (b) ES spectrum with gain current for Vrev=5 V.
    Fig. 3. Development of (a) GS and (b) ES spectrum with gain current for Vrev=5V.
    (a) Two opto-thermal spike events for Vrev=4 V and Ibias=205.25 mA; (b) firing rate of the generated spike events as a function of the gain current for the same reverse voltage bias.
    Fig. 4. (a) Two opto-thermal spike events for Vrev=4V and Ibias=205.25  mA; (b) firing rate of the generated spike events as a function of the gain current for the same reverse voltage bias.
    Spike amplitude for Vrev=5 V close to the low GS injection threshold. The points (a), (b), and (c) correspond to Ibias=218, 219, and 221 mA.
    Fig. 5. Spike amplitude for Vrev=5V close to the low GS injection threshold. The points (a), (b), and (c) correspond to Ibias=218, 219, and 221 mA.
    RF spectra and time traces for 5 V reverse voltage and Ibias=218 (a), 219 (b), and 221 mA (c).
    Fig. 6. RF spectra and time traces for 5 V reverse voltage and Ibias=218 (a), 219 (b), and 221 mA (c).
    Mean amplitude and standard deviation of the GS spike events for biasing close to the high GS threshold and Vrev=5 V. The marks (a) and (b) correspond to Ibias=411 and 419 mA.
    Fig. 7. Mean amplitude and standard deviation of the GS spike events for biasing close to the high GS threshold and Vrev=5  V. The marks (a) and (b) correspond to Ibias=411 and 419 mA.
    (a) Detuning between the SL spectrum (black solid line) and the ML spectrum changes with increasing ML gain current (320 mA for the blue line with circles and 480 mA for the red line with triangles); (b) dependence of the number of generated spike events on the ML gain current. The SL is biased at Vrev=4.5 V and Ibias=406 mA, whereas the ML is biased at Vrev=3 V.
    Fig. 8. (a) Detuning between the SL spectrum (black solid line) and the ML spectrum changes with increasing ML gain current (320 mA for the blue line with circles and 480 mA for the red line with triangles); (b) dependence of the number of generated spike events on the ML gain current. The SL is biased at Vrev=4.5  V and Ibias=406  mA, whereas the ML is biased at Vrev=3  V.
    Mean amplitude and standard deviation of GS spike events as a function of the injection strength for optical triggering, with the ML biased at 3 V reverse voltage. SL is biased at 5 V reverse voltage and (a) 218 mA—close to the low gain current threshold; (b) 409 mA—close to the high gain current threshold. Time traces for mean injection power equal to −9 dBm are shown for (c) 218 mA and (d) 409 mA.
    Fig. 9. Mean amplitude and standard deviation of GS spike events as a function of the injection strength for optical triggering, with the ML biased at 3 V reverse voltage. SL is biased at 5 V reverse voltage and (a) 218 mA—close to the low gain current threshold; (b) 409 mA—close to the high gain current threshold. Time traces for mean injection power equal to 9  dBm are shown for (c) 218 mA and (d) 409 mA.
    Spike width as a function of the reverse bias and ES emission (a) close to the low GS current threshold; (b) close to the high GS current threshold. (c) 500 ps spike event recorded for SL with Ibias=407 mA and Vrev=5.5 V.
    Fig. 10. Spike width as a function of the reverse bias and ES emission (a) close to the low GS current threshold; (b) close to the high GS current threshold. (c) 500 ps spike event recorded for SL with Ibias=407  mA and Vrev=5.5V.
    PropertiesIntegratorsResonators
    ExcitabilityClass IClass IIClass II
    Subthreshold oscillationsNoYes
    Frequency preferenceNoYes
    ThresholdWell definedMay not be defined
    All-or-none spikingYesNo (*yes)
    BistabilityNoYesNoYes
    BifurcationSaddle node onlimit cycleSaddle node off limit cycleSupercritical Hopf (*canard explosion)Subcritical Hopf
    Table 1. Major Neurocomputational Properties [21]
    George Sarantoglou, Menelaos Skontranis, Adonis Bogris, Charis Mesaritakis. Experimental study of neuromorphic node based on a multiwaveband emitting two-section quantum dot laser[J]. Photonics Research, 2021, 9(4): B87
    Download Citation