• Acta Optica Sinica
  • Vol. 40, Issue 9, 0914001 (2020)
Zhiyong Lu1、2, Zhiqian Xu1、2, Cui Meng1、2、*, and Hanbing Jin3
Author Affiliations
  • 1Department of Engineering Physics, Tsinghua University, Beijing 100084, China
  • 2Key Laboratory of Particle & Radiation Imaging (Tsinghua University), Ministry of Education, Beijing 100084, China;
  • 3Beijing Jinghang Computing and Communication Research Institute, Beijing 100074, China
  • show less
    DOI: 10.3788/AOS202040.0914001 Cite this Article Set citation alerts
    Zhiyong Lu, Zhiqian Xu, Cui Meng, Hanbing Jin. Numerical Simulation of Electromagnetic Pulse in Target Chamber of Nanosecond Laser Inertial Confinement Facility[J]. Acta Optica Sinica, 2020, 40(9): 0914001 Copy Citation Text show less
    Schematic diagram of computational model
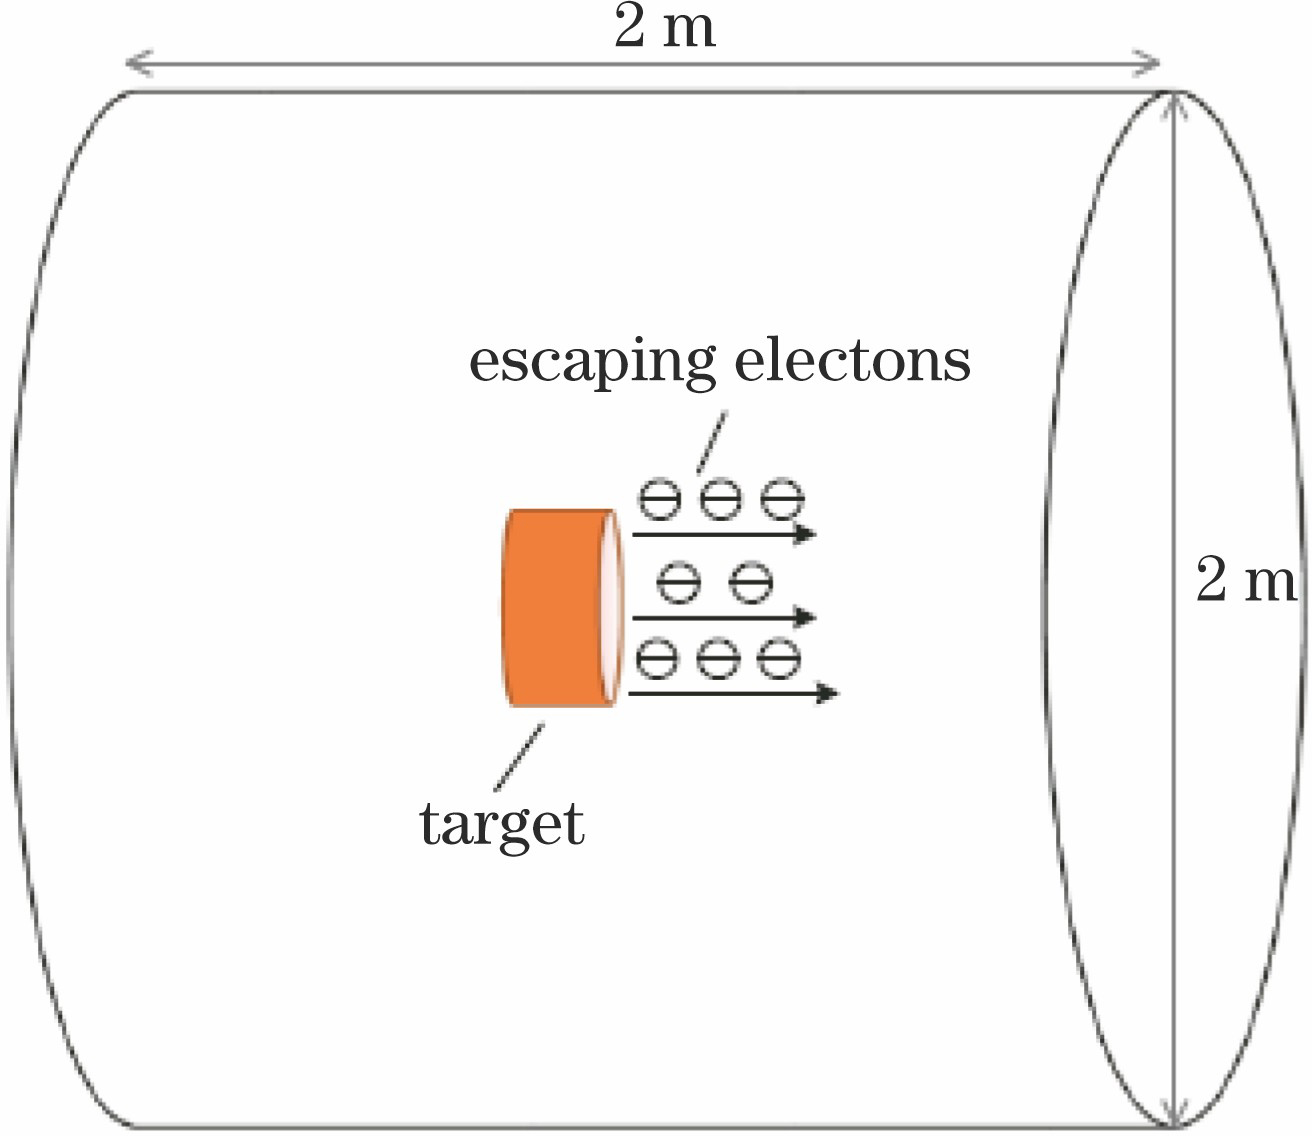
    Fig. 1. Schematic diagram of computational model
    Schematic diagram of simulation process
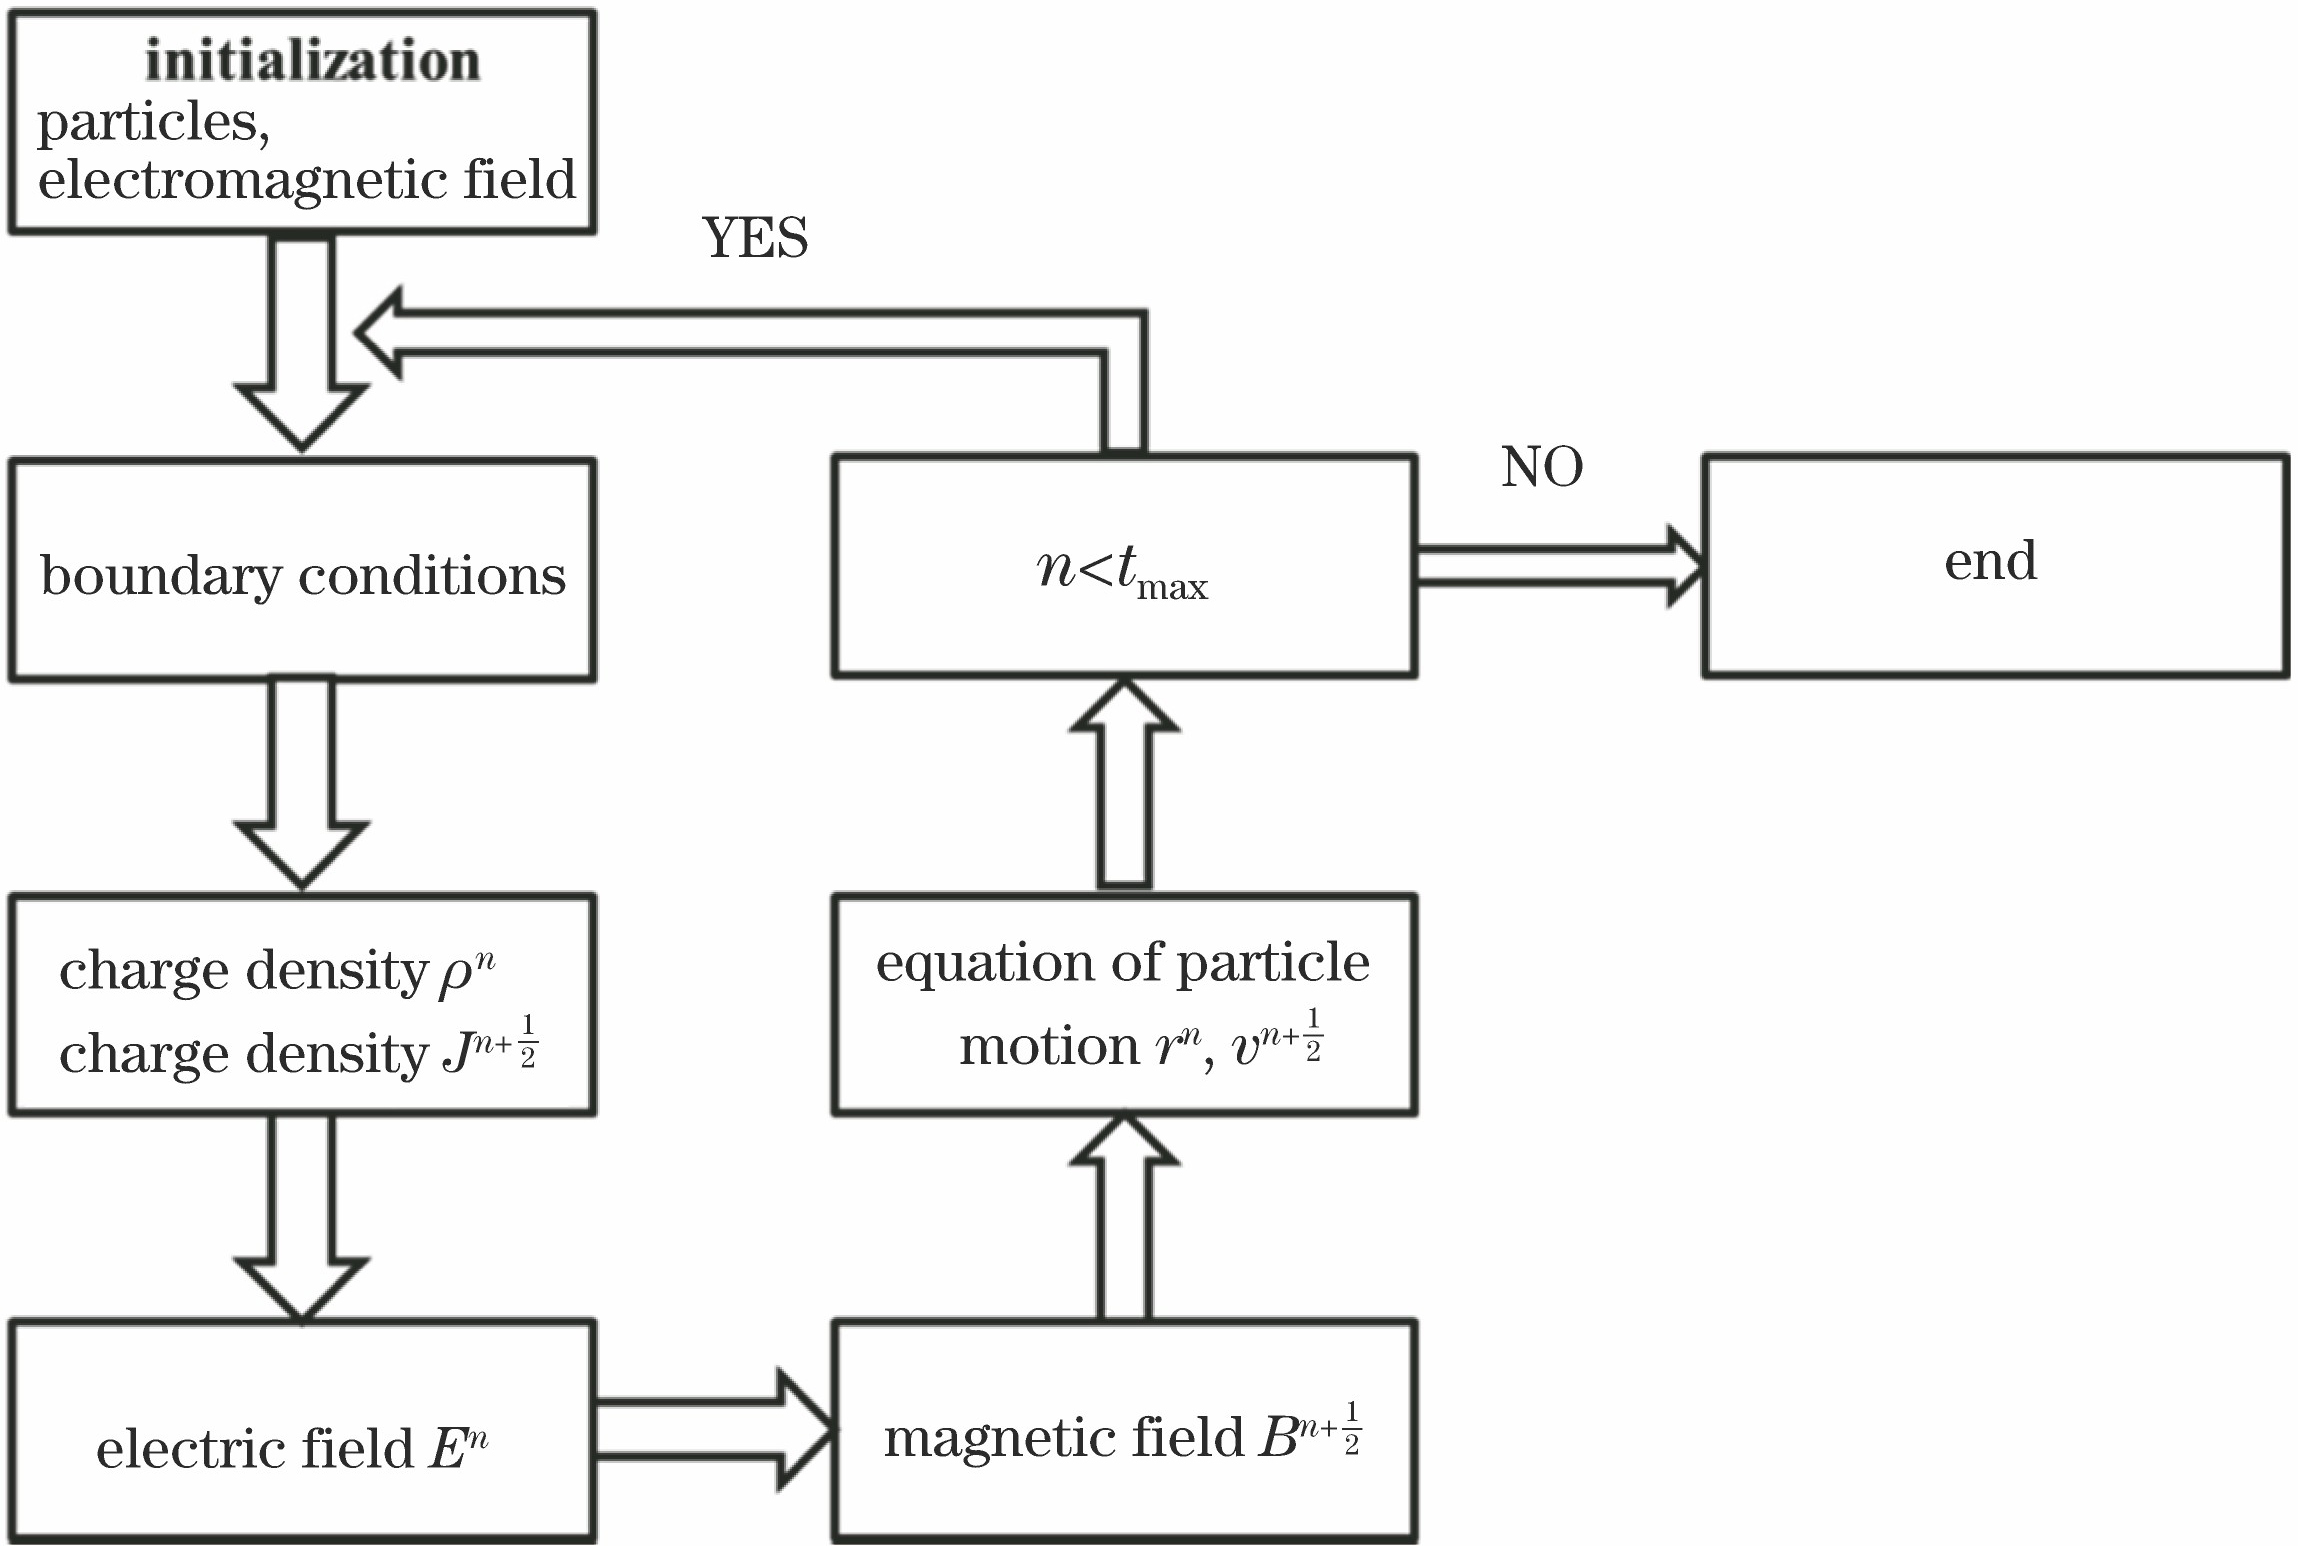
    Fig. 2. Schematic diagram of simulation process
    Waveform of particle clouds at different emitting waveform widths
    Fig. 3. Waveform of particle clouds at different emitting waveform widths
    Spectra of electric field. (a) te=1 ns; r=200 mm, z=500 mm; (b) te=9 ns; r=200 mm, z=500 mm; (c) te=1 ns; r=800 mm, z=1500 mm; (d) te=9 ns; r=800 mm, z=1500 mm
    Fig. 4. Spectra of electric field. (a) te=1 ns; r=200 mm, z=500 mm; (b) te=9 ns; r=200 mm, z=500 mm; (c) te=1 ns; r=800 mm, z=1500 mm; (d) te=9 ns; r=800 mm, z=1500 mm
    Peak values of electromagnetic field close to target at different emitting waveform widths
    Fig. 5. Peak values of electromagnetic field close to target at different emitting waveform widths
    Peak values of average charge density in the target chamber at different emitting waveform widths
    Fig. 6. Peak values of average charge density in the target chamber at different emitting waveform widths
    Spectra of electric field at different emitting waveform widths. (a) 1 ns; (b) 4 ns; (c) 10 ps; (d) 100 ps
    Fig. 7. Spectra of electric field at different emitting waveform widths. (a) 1 ns; (b) 4 ns; (c) 10 ps; (d) 100 ps
    Emitting waveform width /psPeak value of electromagnetic field /(V·m-1)Peak value of average charge density in the target chamber /(10-9 C·m-3)
    102086.731.016990
    502039.881.015090
    1002022.941.015020
    5001138.631.013430
    Table 1. Peak value of electromagnetic field at r=200 mm, z=500 mm in target chamber of picosecond laser inertial confinement facility
    Emitting waveform width /nsPeak value of electromagnetic field /(V·m-1)Peak value of average charge density in the target chamber /(10-9 C·m-3)
    11058.311.012660
    2751.081.010920
    3672.181.009200
    4622.111.007550
    5577.260.997511
    6539.330.972503
    7495.860.935342
    8450.440.890672
    9407.030.843435
    10376.230.796186
    Table 2. Peak value of electromagnetic field at r=200 mm, z=500 mm in target chamber of nanosecond laser inertial confinement facility
    Zhiyong Lu, Zhiqian Xu, Cui Meng, Hanbing Jin. Numerical Simulation of Electromagnetic Pulse in Target Chamber of Nanosecond Laser Inertial Confinement Facility[J]. Acta Optica Sinica, 2020, 40(9): 0914001
    Download Citation