
E. F. J. Bacon, M. King, R. Wilson, T. P. Frazer, R. J. Gray, P. McKenna. High order modes of intense second harmonic light produced from a plasma aperture[J]. Matter and Radiation at Extremes, 2022, 7(5): 054401
- Matter and Radiation at Extremes
- Vol. 7, Issue 5, 054401 (2022)
Abstract
I. INTRODUCTION
The ability to manipulate light at relativistic intensities1 (
The conventional approach to manipulating light is based on using solid-state optical media, but there is a limit to the energy density that these media can withstand before nonlinear effects distort the laser pulse and the optics themselves are damaged. This is typically circumvented by increasing the size of the optics as the laser energy is increased so that the overall energy density is below the critical value. However, large-area optics are very expensive, with long manufacture times and limited maneuverability because of their volume and weight. By contrast, plasma optical components are inherently compact, easily achieving energy densities of more than two orders of magnitude higher. In addition, the ultrafast evolution of the optical properties of laser-excited plasma enables other properties of the laser pulse to be tailored. By using plasma-based optics, it is possible to enhance the temporal intensity contrast of the laser pulse,15–17 refocus it to enhance the laser peak intensity significantly,18–20 compress its temporal profile,21 generate high harmonics,22–24 and amplify the pulse.25–27 Through the interaction of intense light with dense plasma oscillations, the production of transient plasma gratings,28–30 holograms,31 and coherent emission of light32 can also be achieved.
In recent studies involving intense laser-pulse interactions with ultrathin (tens of nanometers) foils, we introduced the concept of a self-generated relativistic plasma aperture that enables the laser light to pass through a region of an initially opaque target, resulting in diffraction and manipulation of the particle dynamics in the corresponding field structures.33,34 This plasma aperture forms because a region of the target becomes relativistically transparent35 to the laser light, which occurs when the plasma frequency ωp [
![]()
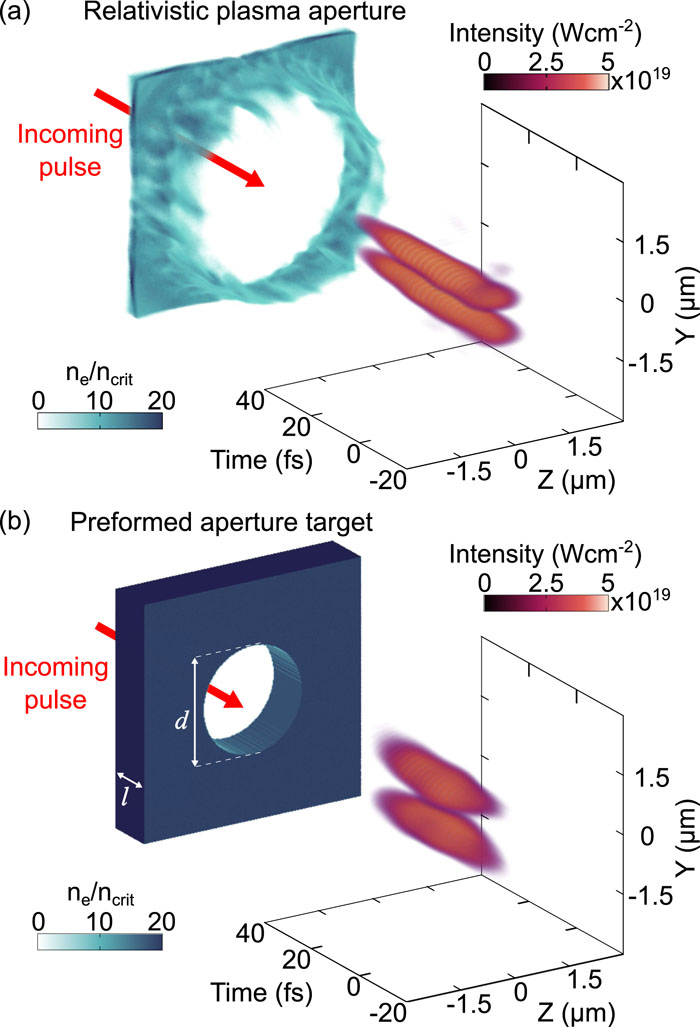
Figure 1.Example 3D simulation results demonstrating the generation of relativistically intense frequency-doubled light in a higher-order spatial mode (TEM01) driven by intense laser light in a fundamental TEM00 mode: (a) self-generated relativistic plasma aperture in an initially solid-density 10-nm-thick aluminum target; (b) preformed aperture target with thickness
The laser–plasma-aperture interaction effectively acts to transfer energy from the incoming laser pulse—which has a fundamental Gaussian spatial mode structure—to intense harmonic light in higher-order modes. This could potentially be developed as a plasma optical device. Although the use of ultrathin targets is challenging because of their fragility, which can limit the shot repetition rate, the scheme could potentially be simplified by using micrometer-thick targets incorporating a preformed circular aperture to produce the same effect.36 This is illustrated in Fig. 1(b), which is an example 3D simulation result showing the generation of relativistically intense 2ωL light in the TEM01 mode in a target with thickness l = 2 μm and aperture diameter d = 3 μm. These targets could then also be used as a platform to test more readily the underlying physics that occurs during the formation of a relativistic plasma aperture.
Herein, we investigate the potential use of preformed-aperture targets for generating frequency-doubled light with higher-order spatial mode structures. Using 2D and 3D PIC simulations, we determine the optimum target parameters to maximize the efficiency of energy transfer, and we show that this is related to the fraction of light transmitted through the aperture, the strength of the longitudinal electric field at the aperture edge, and the absorption of the laser pulse. Using 3D simulations, we compare the generation efficiency and mode structure formation when the polarization is varied from linear to circular. The results highlight the feasibility of using a preformed-aperture target—resulting in a plasma aperture—as a type of plasma optical device for mode conversion of intense light.
II. METHODS
To investigate and optimize the generation of frequency-doubled light in higher-order spatial modes, 2D and 3D simulations were performed using the fully relativistic PIC code EPOCH.38 For the 2D case, the simulation XY grid was defined as 1000 × 720 mesh cells, corresponding to 20 × 20 μm2. For the 3D simulations, the XYZ grid was defined as 1000 × 720 × 720 cells, corresponding to 20 × 20 × 20 μm3. The targets comprised a slab of Al13+ ions of thickness l with a circular aperture of diameter d. This was neutralized with an electron population with a peak density of 30ncrit and an initial temperature of 10 keV. Each species was initialized with an average of 80 particles per cell in the 2D case and five particles per cell in the 3D case. All the boundaries of the simulation box were defined as free-space ones, and the ions were mobile in all cases.
In both the 2D and 3D simulations, the pulse of laser light with wavelength λL = 800 nm entering from the left (X) boundary and was focused at the plane corresponding to the front surface of the target (X = 0). Both the laser-pulse temporal and spatial profiles were defined in terms of intensity as Gaussian with pulse duration τL = 40 fs [full width at half maximum (FWHM)] and focal-spot diameter ϕL = 2.1 μm (FWHM). Time t = 0 was defined as when the peak of the pulse reached the front surface of the target, i.e., the front of the aperture. The 3D simulations were performed using linear polarization in the Y direction and circular polarization. In the 2D simulations, only linear polarization in the Y direction was used because circular polarization cannot interact with the full aperture edge. The peak laser-pulse intensity IL was varied from 1021 to 1023 W cm−2 by increasing the energy in the pulse. In the 2D simulations, a simulation automation code called BISHOP39—developed by our group—was used to systematically scan a 2D parameter grid of target thickness and aperture diameter; l was varied from 0.5 to 10 μm and d was varied from 0.5 to 5 μm.
III. RESULTS
A. 2D simulations
Figure 2(a) shows the electron density for a target with l = 0.5 μm at t = −4.8 fs from a 2D simulation, demonstrating the generation of electron bunches from the predefined (d = 3 μm) aperture edges as the laser interacts and propagates through; at each side, the electron bunches are emitted with frequency ωL, π out of phase with the opposite side (because of the oscillation of the laser electric field vector), with an overall frequency of 2 ωL when considering the bunches from both sides of the aperture. Figure 2(b) shows an example 2D map of the longitudinal electric field 6 fs thereafter; the pattern is produced by the interference from the two point sources at the opposite edges of the aperture. To investigate the temporal generation of 2 ωL light, an arbitrary electron bunch—circled in Fig. 2(a) with its corresponding position shown 6 fs later in Fig. 2(b)—is tracked through the simulation. In Fig. 2(c), the total kinetic energy Ke in the bunch is plotted as a function of X (the axis of laser propagation), together with the generated 2 ωL intensity I2ωL and the longitudinal electric field experienced EX (both averaged 400 nm around the bunch). The electron bunch is accelerated immediately to relativistic velocities from the aperture edge, before experiencing a decelerating longitudinal electric field as it propagates with the laser and into the sheath field at the target rear (formed because of the charge separation of earlier fast electrons and rear surface plasma surrounding the aperture40,41). This can be observed in Fig. 2(b) as the overall positive electric field (in the positive X direction) at the rear of the target, together with the longitudinal field associated with the laser pulse. Both the acceleration and deceleration of the electron bunch result in broadband emission that interferes constructively with the emission from neighboring bunches, resulting in the generation of 2 ωL light. This is due to the periodic nature of the accelerated bunches produced at either side of the aperture, which have an overall frequency of 2 ωL. As a result of this, the intensity of the 2 ωL light along the longitudinal axis increases with distance from the aperture for ∼5 μm, after which it saturates and then reduces as the generated 2ωL light expands away from the sampled region in the vicinity of the bunch.
![]()
Figure 2.Top row: 2D simulation results for a target with
Figures 2(d)–2(f) show the corresponding results for the case l = 10 μm (d = 3 μm), for which the aperture effectively becomes a channel. In this case, Fig. 2(e) shows the longitudinal electric field 24 fs after the electron density plot in Fig. 2(d), when the bunch has reached the rear of the target. As can be seen in Fig. 2(f), the initial acceleration of the electron bunch and generation of 2ωL light are similar to those in case of l = 0.5 μm. However, as the electron bunch and laser co-propagate within the extended plasma aperture/channel, the electrons experience the positive longitudinal field associated with the focused Gaussian pulse (due to the divergence of the laser electric field profile, i.e.,
The aperture diameter and target thickness influence the energy conversion to 2ωL. To determine the influence of these parameters, a detailed parameter scan was performed to observe the changes to the generation efficiency, based on the ratio of the total energy of the generated 2ωL light detected 5 μm from the target rear to the energy of the input laser pulse. Figure 3 shows the conversion efficiency as a function of target thickness and aperture diameter for three different laser intensities. For IL = 1021 W cm−2, the optimal efficiency is found to be d ∼ 2 μm, shown in Fig. 3(a) as region I. At this aperture diameter, the efficiency saturates for l ≳ 6 μm. When the aperture diameter is increased, the edges of the aperture experience less interaction with the longitudinal field of the laser pulse and the efficiency of 2ωL thus reduces, as observed in region II.
![]()
Figure 3.2D simulation results showing the efficiency of 2
Region III indicates that for small d, the efficiency decreases with increasing l. This is due to poor matching conditions between the free-space Gaussian laser beam focus and the close-to-cut-off modes that can exist within the aperture when the thickness is increased beyond the wavelength; this acts to attenuate the beam within the aperture. As d is reduced from the optimal at 2 μm (for the 2.1-μm FWHM laser focal spot), the generation efficiency therefore becomes very dependent on l. For the thickest targets, the efficiency reduces to negligible levels because the beam is attenuated greatly. However, reducing l enables appreciable efficiency to be regained, as indicated by region IV. This is due to the aperture evolving with the laser pulse. While small apertures inhibit the propagation of laser light because of poor matching conditions, the transverse ponderomotive force of the focused light is intense enough to expel the plasma from the focal-spot region. If the target is thin enough, this expulsion is sufficient to increase the size of the aperture and continue to generate 2ωL light, similar to that of the interaction with an ultrathin foil target as reported by Duff et al.36 This effect can be observed more readily as the peak intensity is increased. At IL = 1022 W cm−2, as shown in Fig. 3(b), the generation efficiency for the smallest d occurs over a much larger l range, and region IV widens in the 2D parameter map. As the intensity is increased further to IL = 1023 W cm−2, as shown in Fig. 3(c), region IV becomes broad across the entire d and l ranges, resulting in no observable region III. This effect is likely to be exaggerated by the reduced peak density (in comparison to the solid density of ∼430ncrit) used in the simulations. In this scenario, IL is high enough at the edges of the aperture that the heating of the plasma by the laser is sufficient for the interaction region to become relativistically transparent near the peak of the pulse, regardless of d. This acts to reduce the efficiency of the generation mechanism because the effective aperture diameter is now much larger than the starting value, in all cases. The optimal condition at d ∼ 2 μm still exists because the rising edge of the laser pulse (with less intensity) still interacts with the initial aperture diameter.
B. Efficiency modeling
Next, we explore the observed dependence of the 2ωL generation efficiency on d and l. It is shown above that during the interaction of the laser pulse with the aperture edge, the longitudinal electric field acts to accelerate and decelerate the bunched electrons. It is therefore assumed that the magnitude of the field close to the aperture edge plays a role in defining the efficiency of 2ωL generation. The longitudinal electric field for a pulse with a focused Gaussian spatial profile can be determined from the spatial differential of the electric field along the polarization direction. The maximum absolute value of this field is at a transverse position of Y ∼ ϕL/2. As such, as d is increased, the magnitude of this longitudinal electric field at the aperture edge, EX, is maximized when d ∼ ϕL; this is shown in Fig. 4(a). For a pulse that is linearly polarized in the Y dimension, EX is defined as
![]()
Figure 4.Three parameters that vary with both target thickness and aperture diameter, for the interaction with a 1021 W cm−2 laser pulse: (a) magnitude of the longitudinal electric field at the aperture edge; (b) the energy into the aperture; (c) the laser absorption. (d) Conversion efficiency to 2
The fraction of the laser light that can enter the aperture is another factor that influences 2ωL generation. The greater the energy that can propagate through the aperture, the greater the potential conversion into second-harmonic light. The energy in the pulse that can enter the aperture, Kin, is shown in Fig. 4(b) for the 2D simulations and is given by
A third parameter influencing conversion to 2ωL light is the overall absorption of the energy of the laser pulse into the electron bunches, AbsL, as it propagates through the aperture. We assume that this varies linearly with l with an absorption coefficient α because the number of electrons exposed to the propagating laser pulse increases with l. We also assume an exponential attenuation of the laser pulse with thickness with an attenuation constant β. Because the actual attenuation of the laser pulse is complicated by effects such as self-focusing and reflection, the attenuation constant is treated as a free parameter, approximated based on the level of transmitted light in the simulation results (β = 0.1). This is shown in Fig. 4(c), and the overall absorption is given as
Assuming that these parameters are related linearly gives the following first-order approximate relationship for the 2ωL conversion efficiency
C. 3D simulations
Because harmonic light from the plasma aperture can be produced in non-symmetric modes,36,37 it is necessary to extend the investigation to include 3D simulations. Because of the substantially increased computational requirements in doing so, a reduced set of simulations was performed to check whether the efficiency dependencies observed in 2D are the same in 3D. The results are presented in Fig. 5(a). The overall trends in the dependencies on l and d are similar to the 2D results, noting that the maximum conversion efficiency is reduced to ∼3.5% and the optimal d is found to be slightly larger at 3 ± 0.5 μm (compared to 2 μm for 2D). The reduction in conversion efficiency is likely due to the fact that in 2D, the intensity is simulated only in the plane of the laser polarization where the polarization vector is perfectly normal to the aperture edge. In 3D, there is no significant interaction when the polarization vector is parallel to the aperture edge, resulting in proportionally less energy available to produce 2ωL light. The additional degree of freedom also means that the accelerated electrons are less confined to the laser field as they propagate. The total area of the laser focus, as well as the area of the aperture, must be considered in 3D, which modifies Eq. (3) as follows:
![]()
Figure 5.3D simulation results. (a) 2
For a direct comparison of the dependencies of
The 2D and 3D simulation results exhibit similar overall trends. The efficiency increases rapidly with d to an optimum value, and as the aperture size is increased beyond this,
To illustrate the self-focusing and scalloping behavior in the plasma aperture, Fig. 6 shows the laser intensity profile of the drive laser pulse in two example targets with differing l.
![]()
Figure 6.Intensity profile of the drive laser light in the
Figures 6(a) and 6(b) show the ωL intensity profile in the XY plane along Z = 0 from the 3D simulations for l = 0.5 μm at example times t = 16 and 32 fs, respectively. The laser pulse is observed to experience self-focusing as it passes through the aperture to a position of X ≈ 2.5 μm before expanding out into free space. Note that the intensity increases from the nominal intensity of 1 × 10²¹ W cm−2 (without plasma) to ∼4 × 10²¹ W cm−2. This is twice as high as can be achieved with the same focus in the 2D simulations because of dimensionality effects (the pulse energy can be focused only in a plane in 2D but radially in 3D). When l is increased to 10 μm, as shown for the same example times in Figs. 6(c) and 6(d), the self-focusing behavior is very similar, but the expansion is inhibited by the extended aperture/channel in this case, resulting in scalloping behavior. At the later time step [Fig. 6(d)], the pulse is observed to have refocused toward the rear of the target.
In the 3D simulations, the spatial structure of the generated 2ωL light takes the form of a TEM01 mode. The exact spatial distribution of the mode depends on the aperture geometry. Figures 7(a)–7(d) show the change in the mode structure as d is increased for fixed l = 6 μm. This is temporally integrated over the full pulse duration. For the smallest aperture (d = 1 μm), low levels of 2ωL light are generated (note the change in fluence scale) but the TEM01 mode is still observed. As d is increased, the mode structure becomes very clear and the overall beam size is observed to reduce. As the aperture size is increased, there are also low amounts of 2ωL light produced outside of this central mode, with even higher-order structures. This is caused by the interference of the generated light varying as the sources are moved farther apart.37 These can be seen more readily on a logarithmic scale, as shown in Fig. 8(a).
![]()
Figure 7.Time-integrated spatial mode structure at 5
![]()
Figure 8.Time-integrated spatial mode structure at 5
D. Polarization effects
All the simulation results discussed thus far involve linear polarization. When the drive laser pulse is circularly polarized, high harmonic light is produced with a Laguerre–Gaussian (LG) mode structure.37 To explore the effect of polarization on the 2ωL conversion efficiency, a further subset of simulations was also performed for circularly polarized drive laser light. In this case, the peak intensity was halved to maintain the same pulse energy as in the linear pulse case.
Figures 5(c) and 5(d) show the conversion efficiency as a function of d and l with circular polarization for the same fixed parameters as in the linear cases. The overall trends are similar to the linear polarization cases, but with a general increase in overall efficiency in conversion to 2ωL light. This is due to the polarization vector always being normal to the aperture edge in the case of circular polarization, resulting in 2ωL light being produced over the entire wave period.
Figures 7(e)–7(h) show the variation in spatial distribution of the temporally integrated 2ωL light for circular polarization as d is varied. The generated mode takes the form of a ring distribution,37 as expected from an LG mode. Similar to the linear polarization case, the aperture diameter affects the size of the main central ring and low-level higher-order ring-like distributions are evident as separation of the electron bunches increases (i.e., with increasing d), resulting in a change to the interference pattern. This is seen more clearly on the logarithmic scale in Fig. 8(b).
E. Effects of temporal intensity contrast
In practice, depending on the temporal intensity contrast of the laser pulse, some degree of ionization and expansion of the target may be induced early in the interaction, prior to the arrival of the main pulse. Various techniques can be applied to improve the contrast of the pulse, including using plasma mirrors,15–17 but depending on the final intensity profile of the leading edge of the laser pulse, preplasma may still be generated, resulting in an expansion of plasma toward the center of the aperture. This will result in a reduction of the effective aperture diameter as the critical surface moves inward, causing the 2ωL light generation to have the characteristics of that produced by a smaller-aperture target.
The rising edge of the laser may also produce a degree of underdense plasma within the aperture, which may affect how the laser pulse propagates. To test the impact of this, a series of 3D simulations was conducted in which the inside of a d = 3 μm, l = 6 μm aperture target was filled with plasma of varying density. Figure 9(a) shows the influence of this on the efficiency of conversion to 2ωL light. For densities less than 0.1ncrit, there is very little (a few percent) reduction in conversion efficiency. The reduction is more significant at higher densities (∼60% at ncrit), but the targets are not expected to be used under a temporal intensity contrast so low as to induce such a closure of the aperture. A full investigation of this would require 3D magnetohydrodynamic simulations, which are beyond the present scope.
![]()
Figure 9.(a) Conversion efficiency to 2
F. Effects of tapering the aperture
The results presented so far involve targets for which the entrance and exit apertures are the same size, creating a parallel channel in cases with a large thickness-to-diameter ratio. It is possible to optimize the 2ωL light generation further by shaping the target geometry to control the self-focusing of the laser pulse. An additional series of 3D simulations was run in which the walls of the channel created within the aperture were angled (forming a conical target) by defining different entrance and exit diameters d1 and d2, respectively. Figure 9(b) shows the efficiency of conversion to 2ωL light as a function of d1 for fixed l = 6 μm and d2 = 2 μm. The conversion efficiency is improved by increasing the size of the entrance diameter, reaching a maximum of ∼6.9% for an optimum d1 = 8 μm. The optimum occurs when the convergence angle of the laser undergoing self-focusing matches the angle of the cone walls. This can be seen readily when comparing Figs. 9(c) and 9(d). For the case d1 = 3 μm [Fig. 9(c)], self-focusing of the propagating light results in a focal position inside the target, similar to Fig. 6(c). For d1 = 8 μm, the propagating laser light self-focuses close to the exit aperture. For higher d1, the focal position moves increasingly beyond the exit aperture and the laser pulse interacts with a shorter length of plasma wall, because the laser pulse needs to propagate deep within the aperture before interacting with it. It may be possible to tailor the geometry of these targets further to improve the conversion efficiency, and the optimum may also depend on the temporal intensity contrast of the laser pulse.
IV. CONCLUSIONS
Following our previous work on the self-generation of a relativistic plasma aperture during the interaction of intense laser light with an ultrathin foil33 and the resultant harmonic generation in higher-order spatial modes,36 we have performed a numerical investigation to explore the use of a preformed plasma aperture to achieve a similar output with a simpler target. The results showed that incoming laser light in a fundamental TEM00 mode is converted to relativistically intense second-harmonic radiation emission in higher-order modes. The efficiency of conversion was explored as a function of aperture diameter and target thickness, and it was found that there is an optimal diameter at which the conversion efficiency saturates with increasing thickness. This was shown to be proportional to the intensity of light that can enter the aperture, the strength of the longitudinal electric field at the aperture edge, and the absorption of the laser energy. This study was performed for linear polarization in both 2D and 3D, which overall exhibit the same trends, allowing a multi-dimensional parameter space to be explored more readily using computationally efficient 2D simulations. Extension to circular polarization in 3D produced broadly similar trends in conversion efficiency.
For the parameter range explored, the optimum target conditions for generating 2ωL light in the TEM01 mode yielded a conversion efficiency of ∼6.9%, while the optimal efficiency for generating a 2ωL LG mode was found to be ∼4%. There is potential for this to be increased further by tuning the profile of the tapered targets. As the intensity of the input pulse is increased, the efficiency is reduced slightly, but conversion efficiency of this order still produces 2ωL light that is sufficiently intense to induce highly relativistic plasma oscillations. It has also been shown that there is scope for tuning the size of the mode structure and the mode order by varying the aperture diameter. This demonstrates that a preformed-aperture target irradiated by an intense laser pulse can function as a plasma optical device for generating 2ωL light with a spatial mode structure that can be changed from non-OAM to OAM by varying the drive laser polarization.
ACKNOWLEDGMENTS
Acknowledgment. This work was supported financially by EPSRC (Grant Nos. EP/R006202/1 and EP/V049232/1) and STFC (Grant No. ST/V001612/1). It involved the use of the ARCHIE-WeSt and ARCHER2 high-performance computers, with access to the latter provided via the Plasma Physics HEC Consortia (Grant No. EP/R029148/1), and the University of Cambridge Research Computing Service (funded by Grant No. EP/P020259/1). EPOCH was developed under EPSRC Grant No. EP/G054940/1. The research has also received funding from Laserlab-Europe (Grant Agreement No. 871124, European Union’s Horizon 2020 research and innovation program).
References
[1] S. V.Bulanov, G. A.Mourou, T.Tajima. Rev. Mod. Phys., 78, 309(2006).
[2] H.Daido, M.Nishiuchi, A. S.Pirozhkov. Rep. Prog. Phys., 75, 056401(2012).
[3] M.Borghesi, A.Macchi, M.Passoni. Rev. Mod. Phys., 85, 751(2013).
[4] S. V.Bulanov, T. Z.Esirkepov, V. S.Khoroshkov, A. V.Kuznetsov, F.Pegoraro. Phys. Lett. A, 299, 240-247(2002).
[5] M.Baumann, E.Beyreuther, T.Burris-Mog, T. E.Cowan, W.Enghardt, L.Karsch, S. D.Kraft, L.Laschinsky, J.Metzkes, K.Zeilet?al.. Appl. Phys. B, 110, 437-444(2013).
[6] C.Bernert, S.Bock, E.Bodenstein, F.-E.Brack, K.Brüchner, T. E.Cowan, L.Gaus, R.Gebhardt, U.Helbig, F.Krollet?al.. Nat. Phys., 18, 316-322(2022).
[7] P.Audebert, A.Bigongiari, M.Borghesi, S. V.Bulanov, J.Fuchs, S.Kar, A.Macchi, L.Romagnani, T.Toncian, O.Williet?al.. Plasma Phys. Controlled Fusion, 50, 124040(2008).
[8] P.Antici, M.Barberio, F.Cardelli, S. N.Chen, G.Famulari, T.Gangolf, G.Revet, A.Schiavi, M.Scisciò, M.Senzacqua, S.Vallières. Nat. Commun., 9, 372(2018).
[9] C.Brown, T. E.Cowan, W.Fountain, S. P.Hatchett, J.Johnson, M. H.Key, D. M.Pennington, M.Roth, R. A.Snavely, S. C.Wilkset?al.. Phys. Rev. Lett., 86, 436(2001).
[10] B. J.Albright, F. N.Beg, J. C.Fernández, M. E.Foord, B. M.Hegelich, J. J.Honrubia, M.Roth, R. B.Stephens, L.Yin. Nucl. Fusion, 54, 054006(2014).
[11] J. R.Cary, E.Cormier-Michel, E.Esarey, C. G. R.Geddes, W. P.Leemans, P. J.Mullowney, K.Paul, C. B.Schroeder. Phys. Rev. Spec. Top.–Accel. Beams, 14, 031303(2011).
[12] J. T.Mendon?a, J.Vieira. Phys. Rev. Lett., 112, 215001(2014).
[13] J. T.Mendon?a, F.Quéré, J.Vieira. Phys. Rev. Lett., 121, 054801(2018).
[14] R.Li, S. G.Rykovanov, C. B.Schroeder, J. W.Wang, M.Zepf. Sci. Rep., 7, 16884(2017).
[15] E.F?rster, U.Teubner, U.Wagner. J. Phys. B: At., Mol. Opt. Phys., 34, 2993(2001).
[16] B.Dromey, P.Foster, S.Kar, M.Zepf. Rev. Sci. Instrum., 75, 645-649(2004).
[17] P.Audebert, G.Doumy, J. C.Gauthier, J. P.Geindre, O.Gobert, P.Martin, M.Perdrix, F.Quéré, T.Wittmann. Phys. Rev. E, 69, 026402(2004).
[18] P.Audebert, S.Buffechoux, J.Fuchs, R.Kodama, A.Kon, M.Nakatsutsumi. Opt. Lett., 35, 2314-2316(2010).
[19] C.Armstrong, D. C.Carroll, R. J.Clarke, R. J.Dance, R. J.Gray, S. J.Hawkes, M.King, P.McKenna, D.Neely, D. J.Robertson, R.Wilson. Phys. Plasmas, 23, 033106(2016).
[20] C.Armstrong, N. M. H.Butler, D. C.Carroll, R. J.Clarke, R. J.Dance, R. J.Gray, S. J.Hawkes, M.King, D. J.Robertson, R.Wilson et al. Quantum Beam Sci, 2, 1(2018).
[21] W.Cheng, S.Li, J.Ren, S.Suckewer. Nat. Phys., 3, 732-736(2007).
[22] R.Lichters, J.Meyer‐ter‐Vehn, A.Pukhov. Phys. Plasmas, 3, 3425-3437(1996).
[23] P.Balcou, J.-P.Chambaret, D.Kl?pfel, A.Orisch, G.Rey, A.Tarasevitch, U.Teubner, W.Theobald, D.von der Linde. Phys. Rev. A, 62, 023816(2000).
[24] U.Andiel, K.Eidmann, E.F?rster, J.Meyer-ter-Vehn, F.Pisani, T.Schlegel, U.Teubner, G. D.Tsakiris, U.Wagner, K.Witte. Phys. Rev. Lett., 92, 185001(2004).
[25] N. J.Fisch, J.Meyer-ter-Vehn, A.Pukhov, G.Shvets. Phys. Rev. Lett., 81, 4879(1998).
[26] N. J.Fisch, V. M.Malkin, G.Shvets. Phys. Rev. Lett., 82, 4448(1999).
[27] R.Bingham, R. A.Cairns, F.Fiúza, R. A.Fonseca, P. A.Norreys, L. O.Silva, R. M. G. M.Trines. Nat. Phys., 7, 87-92(2011).
[28] P.Combis, P.D’Oliveira, D.Garzella, S.Kahaly, A.Leblanc, P.Martin, S.Monchocé, F.Quéré, F.Réau, L.Videau. Phys. Rev. Lett., 112, 145008(2014).
[29] Q.Chen, V.Horny, S. X.Lee, D.Maslarova, D.Umstadter, J.Wang. Phys. Rev. Lett., 128, 164801(2022).
[30] Y.Cang, Z.-M.Sheng, H.-C.Wu, J.Zhang, Q.-J.Zhang. Phys. Plasmas, 12, 113103(2005).
[31] M. R.Edwards, N. M.Fasano, E.Kur, N.Lemos, P.Michel, J. M.Mikhailova, V. R.Munirov, A.Singh, J. S.Wurtele. Phys. Rev. Lett., 128, 065003(2022).
[32] K.Mima, H.Sanuki, Z. M.Sheng, J.Zhang. Phys. Rev. Lett., 94, 095003(2005).
[33] N. M. H.Butler, R.Capdessus, R. J.Dance, B.Gonzalez-Izquierdo, R. J.Gray, J. S.Green, S.Hawkes, M.King, J.McCreadie, R.Wilsonet?al.. Nat. Phys., 12, 505-512(2016).
[34] N. M. H.Butler, R. J.Dance, B.Gonzalez-Izquierdo, R. J.Gray, S.Hawkes, M.King, D. A.Maclellan, J.McCreadie, H.Powell, R.Wilsonet?al.. Nat. Commun., 7, 12891(2016).
[35] S. V.Bulanov, N. M.Naumova, F.Pegoraro, V. A.Vshivkov. Phys. Plasmas, 5, 2727-2741(1998).
[36] N.Booth, R.Capdessus, Z. E.Davidson, M. J.Duff, B.Gonzalez-Izquierdo, R. J.Gray, S.Hawkes, A.Higginson, M.King, P.McKenna, D.Neely, S. D. R.Williamson, R.Wilson. Sci. Rep., 10, 105(2020).
[37] L.Yi. Phys. Rev. Lett., 126, 134801(2021).
[38] T. D.Arber, A. R.Bell, K.Bennett, C. S.Brady, R. G.Evans, P.Gillies, A.Lawrence-Douglas, M. G.Ramsay, C. P.Ridgers, H.Schmitz, N. J.Sircombe. Plasma Phys. Controlled Fusion, 57, 113001(2015).
[39] E. J.Dolier, R. J.Gray, M.King, P.McKenna, R.Wilson. New J. Phys..
[40] T. E.Cowan, S. P.Hatchett, E. A.Henry, M. H.Key, T. W.Phillips, M.Roth, T. C.Sangster, M. S.Singh, R. A.Snavely, M. A.Stoyeret?al.. Phys. Rev. Lett., 85, 2945(2000).
[41] T. E.Cowan, S.Hatchett, M. H.Key, A. B.Langdon, A.MacKinnon, D.Pennington, M.Roth, M.Singh, R. A.Snavely, S. C.Wilks. Phys. Plasmas, 8, 542-549(2001).
[42] M. R.Siegrist. Opt. Commun., 16, 402-407(1976).
[43] C.Armstrong, N.Butler, D.Carroll, Z.Davidson, M.Duff, T.Frazer, A.Higginson, J.Jarrett, M.King, R.Wilsonet?al.. Phys. Rev. Res., 2, 042015(2020).


Set citation alerts for the article
Please enter your email address

© Copyright 2018-2021 | Chinese Laser Press. All Rights Reserved 沪ICP备15018463号-20