
Meng Zhang, Xin Wang, Suhui Yang, Bao Li, Zhuo Li, Jinying Zhang, Yanze Gao. High-Efficiency Fiber Combining of Long-Wave Infrared Quantum Cascade Lasers[J]. Acta Optica Sinica, 2024, 44(8): 0814003
- Acta Optica Sinica
- Vol. 44, Issue 8, 0814003 (2024)

Fig. 1. Schematic diagram of fiber-coupled optical system
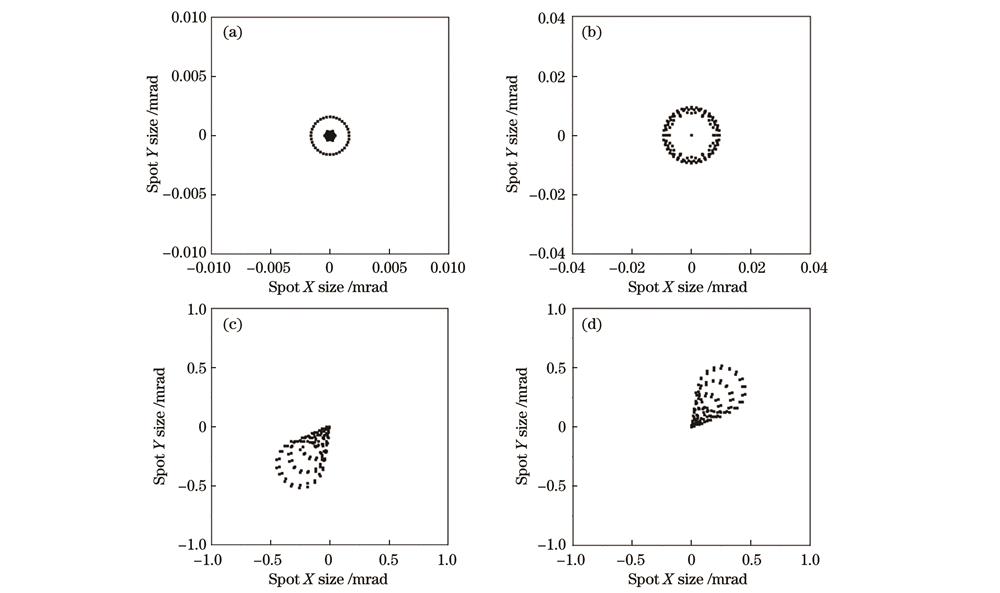
Fig. 2. Simulation results of divergent angles of collimated beams. (a) Divergent angle of point-source QCL collimator; (b) divergent angle of extended-source QCL collimator with (0 mm, 0 mm) field of view; (c) divergent angle of extended-source QCL collimator with (
Fig. 3. Simulation results of divergent angles of two collimators. (a) Point-source QCL collimator; (b) extended-source QCL collimator
Fig. 4. Simulated intensity distributions of collimated beams. (a) QCL collimator with NA of 0.68; (b) QCL collimator with NA of 0.83
Fig. 5. Simulation result of single-channel fiber-tcoupling system. (a) Laser spot on input surface of fiber; (b) laser spot at 0.1 mm away from output surface of fiber
Fig. 6. Single-mode hollow core fiber combiner. (a) Structure diagram of hollow core fiber; (b) transmission loss of single-mode hollow core fiber; (c) picture of single-mode hollow core fiber; (d) picture of single-mode 4×1 hollow core fiber combiner; (e) picture of output surface of single-mode hollow core 4 in 1 fiber combiner under microscope
Fig. 7. Schematic diagram of fiber combining experimental system
Fig. 8. Experimental setup of single-mode fiber coupling system
Fig. 9. Picture of QCL collimator and fiber coupler. (a) QCL collimator with NA of 0.83; (b) fiber coupler
Fig. 10. Experimental results of coupling of single-mode long wave infrared hollow core fiber. (a) Fiber output power; (b) fiber coupling efficiency
Fig. 11. QCL collimating spot and fiber coupling output spot. (a) QCL collimating spot; (b) fiber coupling output spot
Fig. 12. Experimental setup of 4×1 fiber combining system
Fig. 13. Experimental results of QCL 4×1 fiber combining. (a) Fiber coupling output power; (b) total fiber output efficiency and total system coupling efficiency
Fig. 14. Combined QCL beam spots at different positions along beam propagation direction. (a)
Fig. 15. Beam propagation quality factor M2 of combined QCL. (a) X axis; (b) Y axis
|
Table 1. Performance parameters of long-wave infrared QCL
|
Table 2. Lens data of point-source QCL collimator
|
Table 3. Lens data of extended-source QCL collimator
|
Table 4. Lens data of QCL collimator with NA of 0.68
|
Table 5. Lens data of QCL collimator with NA of 0.83
|
Table 6. Lens data of fiber coupler
|
Table 7. Measurement results of QCL output properties

Set citation alerts for the article
Please enter your email address
© Copyright 2018-2021 | Chinese Laser Press. All Rights Reserved 沪ICP备15018463号-20