
Xiaoyu Cui, Wentao Xu, Qirui Guan, Weizhou Luo, Minran Li, Yudi Zhou, Peituo Xu, Bin Liu, Sunqiang Pan, Chong Liu, Qun Liu, Dong Liu. Estimation of organic carbon stocks in the East China Sea[J]. Infrared and Laser Engineering, 2021, 50(6): 20211031
- Infrared and Laser Engineering
- Vol. 50, Issue 6, 20211031 (2021)
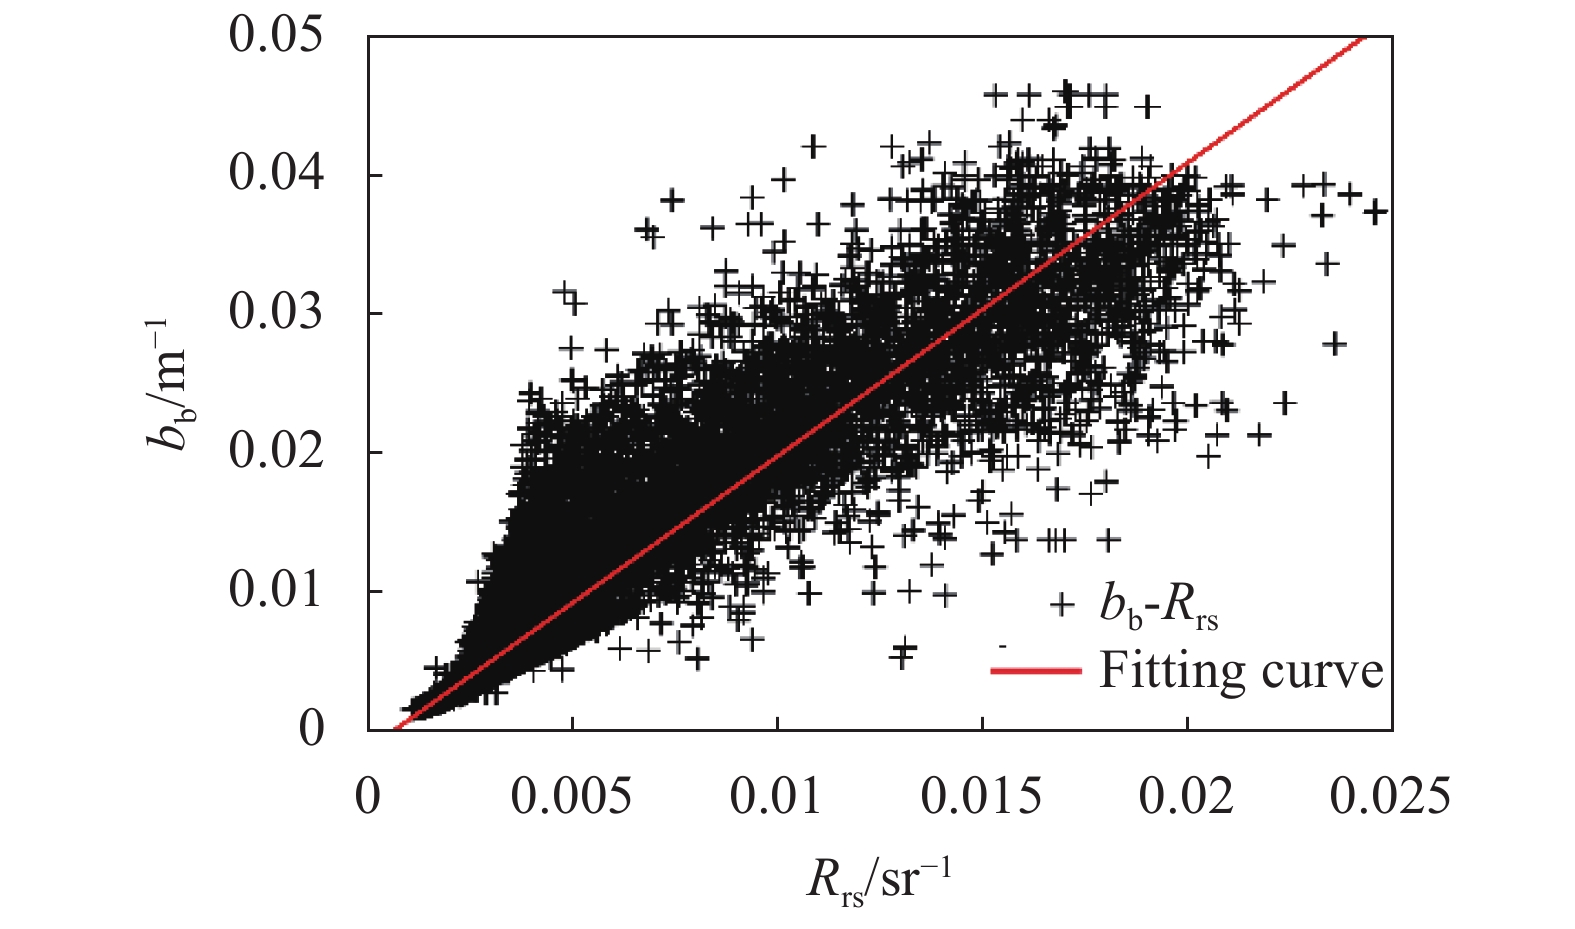
Fig. 1. Correlations between R rs(555) and b bp(555) in the East China Sea in the summer of 2010
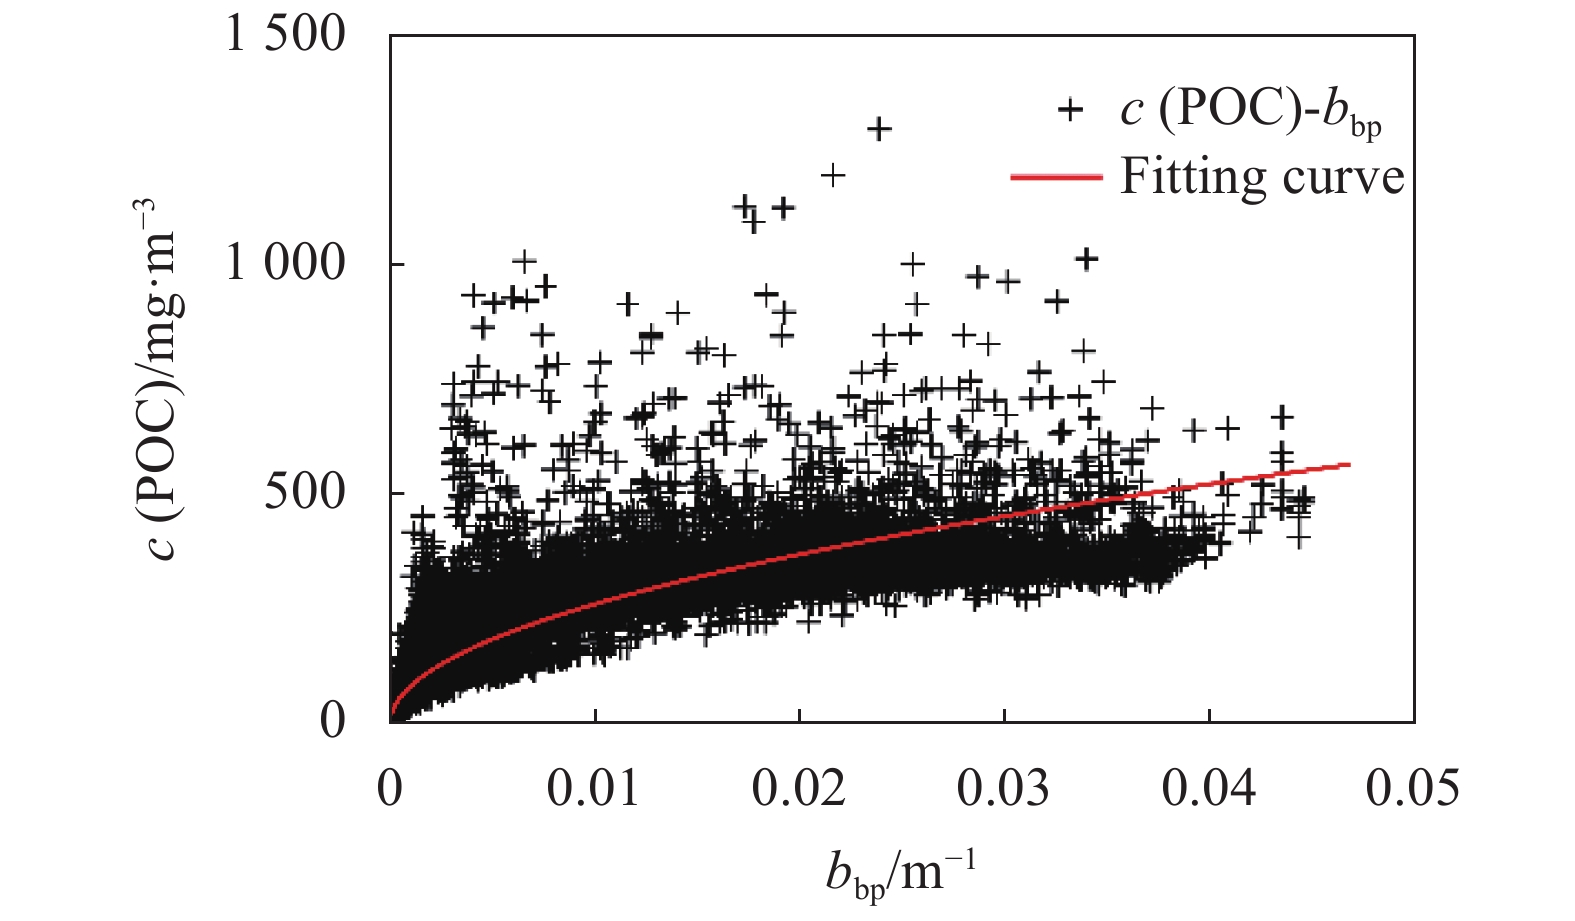
Fig. 2. Correlations between POC concentration and b bp(555) in the East China Sea in the summer of 2010
Fig. 3. Correlations between log(c (POC)) and N in the East China Sea in the spring of 2010
Fig. 4. Comparison of POC concentrations of the results calculated using Two-Step algorithm and the results from Ocean Color
Fig. 5. Estimation results of surface average DOC concentrations in the East China Sea from 2006 to 2010 by using Eq. (5)
Fig. 6. Schematic diagram of POC vertical distribution models. (a) Uniform distribution; (b) Exponential distribution; (c) Gaussian distribution; (d) Folding line distribution
Fig. 7. Schematic diagram of DOC vertical distribution models. (a) Uniform distribution; (b) Stratification distribution
Fig. 8. Distribution of surface POC concentration in the East China Sea in 2010. (a) Spring; (b) Summer; (c) Autumn; (d) Winter
Fig. 9. [in Chinese]
Fig. 9. Distribution of surface DOC concentration in the East China Sea of 2010. (a) Spring; (b) Summer; (c) Autumn; (d) Winter
Fig. 10. Depth distribution of the euphotic layer in the East China Sea in 2010. (a) Spring; (b) Summer; (c) Autumn; (d) Winter
Fig. 11. Estimation of POC stocks in the all water columns and the euphotic layer of the East China Sea in 2010
Fig. 12. Estimation of DOC stocks in the all water columns and the euphotic layer of the East China Sea in 2010
Fig. 13. Comparison of POC stocks in the all water columns of the East China Sea from 2006 to 2015
Fig. 14. Comparison of DOC stocks in the all water columns of the East China Sea from 2006 to 2015
|
Table 1. Fitting coefficients of Two-Step algorithm in the four seasons of 2010
|
Table 2. Fitting coefficients of NDCI algorithm in the four seasons of 2010
| |||||||||||||||||||||||||||||||||||||
Table 3. Estimation result of surface average POC concentrations in the East China Sea in the four seasons of 2010
|
Table 4. Estimation results of surface average DOC concentrations in the East China Sea in 2010 by using Eq.(6a), Eq.(6b) and the modified algorithm
| ||||||||||||
Table 5. Formulas of four POC vertical distribution models

Set citation alerts for the article
Please enter your email address
© Copyright 2018-2021 | Chinese Laser Press. All Rights Reserved 沪ICP备15018463号-20