
Hao-dan ZHANG, Xiao-lin SUN, Xiao-qing WANG, Hui-li WANG. Analyzing Errors due to Measurement Positions and Sampling Locations for In Situ Measurements of Soil Organic Matter Using Vis-NIR Spectroscopy[J]. Spectroscopy and Spectral Analysis, 2020, 40(11): 3499
- Spectroscopy and Spectral Analysis
- Vol. 40, Issue 11, 3499 (2020)
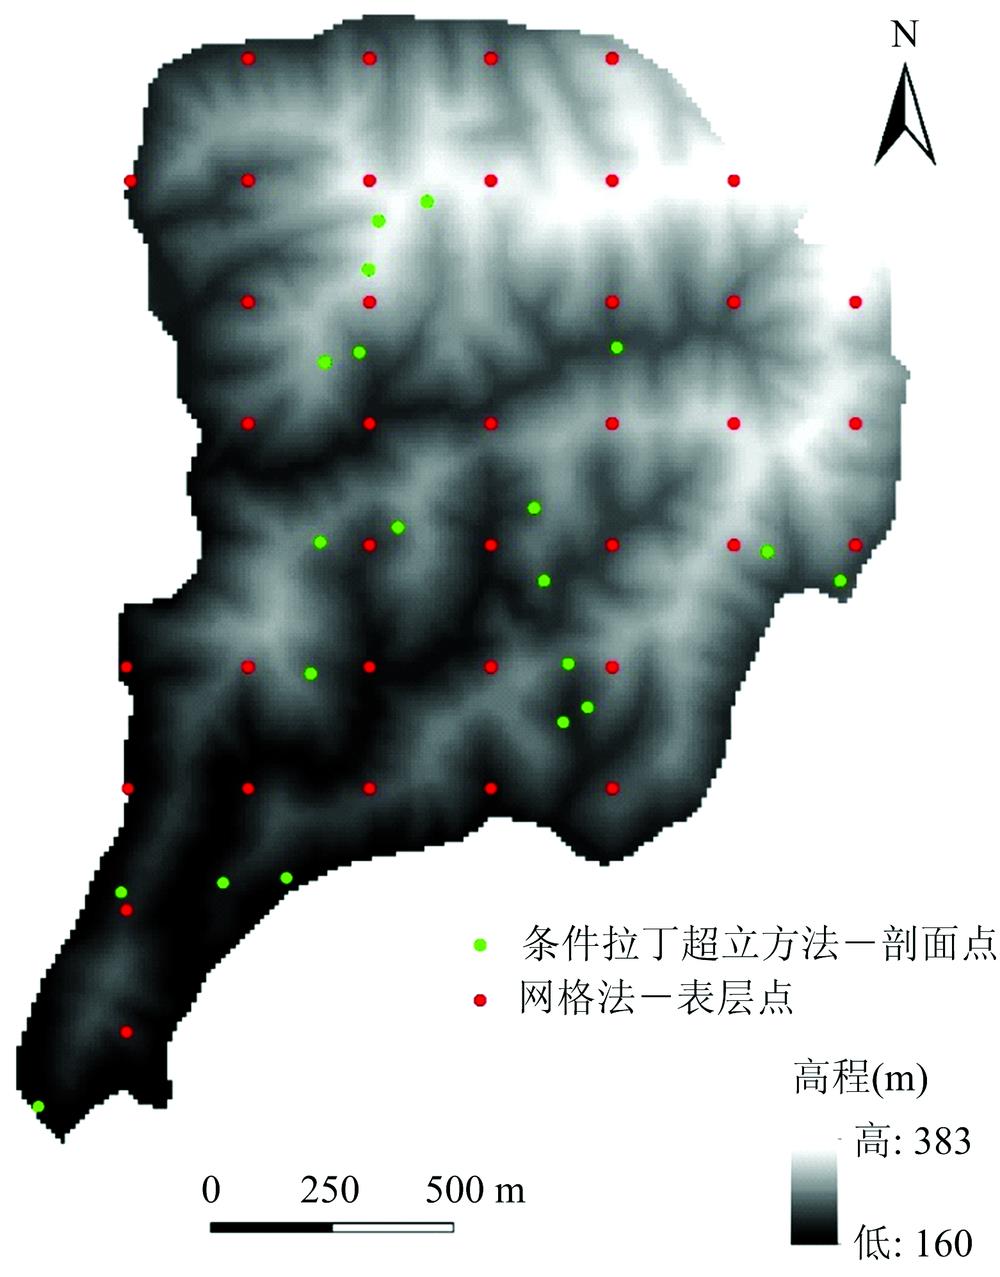
Fig. 1. Distribution of sampling points in the study area
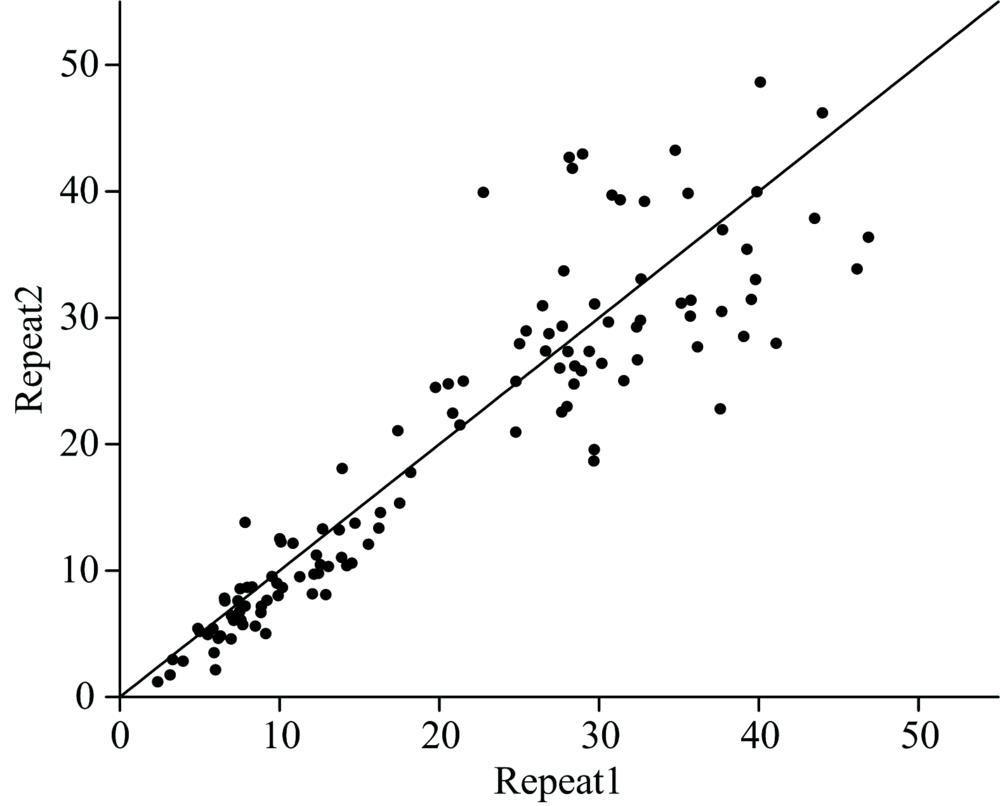
Fig. 2. Comparison of soil organic matter contents of two duplicate sets of samples
Fig. 3. Soil spectral curves of soil horizons with different organic matter contents
(a): Horizon with the lowest soil organic matter content; (b): Horizon with the organic matter content close to average value;(c): Horizon with the highasu soil organic matter content
(a): Horizon with the lowest soil organic matter content; (b): Horizon with the organic matter content close to average value;(c): Horizon with the highasu soil organic matter content
Fig. 4. Soil organic matter content and the differences between soil spectra
(a): The angle between spectrum of each test point and spectrum of each sample; (b): The angle between spectrum of each sample and spectrum of each horizon
(a): The angle between spectrum of each test point and spectrum of each sample; (b): The angle between spectrum of each sample and spectrum of each horizon
Fig. 5. Correlogram of soil organic matter content to spectral reflectance of each sample
Fig. 6. Modeling results of PLSR
(a): Validation: RMSEP (Cross-validated using 236 leave-one-out segments); (b): Training: % variance explained
(a): Validation: RMSEP (Cross-validated using 236 leave-one-out segments); (b): Training: % variance explained
Fig. 7. Statistics of the independent random validation in PLSR prediction model
The red dotted line represents the evaluation result of LOOCV
The red dotted line represents the evaluation result of LOOCV
Fig. 8. Estimated soil organic matter content (black) by the spectrum of each test point (a) and sample (b), and their mean value (green), standard deviation (blue) against the measured. In (b), the estimated are compared with the measured soil organic matter contents, while the other values are compared with the average soil organic matter content of two samples in each horizon
|
Table 1. Statistics of soil organic matter content(g·kg-1)
|
Table 2. Statistics of differences in degree between the sample spectrum and reference spectrum
|
Table 4. Statistics of the error of soil organic matter content estimated by in situ soil spectra (by standard deviation)


Set citation alerts for the article
Please enter your email address

© Copyright 2018-2021 | Chinese Laser Press. All Rights Reserved 沪ICP备15018463号-20