The fluorescence from the out-of-focus region excited by the sidelobes of a Bessel beam is the major concern for light-sheet fluorescence microscopy (LSFM) with Bessel beam plane illumination. Here, we propose a method of applying the subtractive imaging to overcome the limitation of the conventional LSFM with Bessel beam plane illumination. In the proposed method, the sample is imaged twice by line scanning using the extended solid Bessel beam and the ring-like Bessel beam. By subtracting between the two images with similar out-of-focus blur, the improved image quality with the suppression of the Bessel beam sidelobes and enhanced sectioning ability with improved contrast are demonstrated.
Light-sheet fluorescence microscopy (LSFM) is a promising approach to providing three-dimensional (3D) data analysis in living tissues[1,2]. Typically, two separate objectives are used for excitation and detection, where their optical axes are arranged at a right angle. With this arrangement, the sample is illuminated from the side with a long sheet of light and optical sectioning can be achieved[3]. The excitation of the fluorophores is mainly confined within the light sheet, which thus significantly reduces photobleaching and photodamage above and below the focal plane. By scanning the excitation light sheet in the direction, 3D volumetric imaging is obtained. Therefore, LSFM has been applied in solving a number of problems in the thick biological samples where larger volumes, and faster and long-term studies are required[2,4,5].
Usually the light sheet has to be thick to achieve a long and homogenous illumination for a large field of view (FOV). Taking advantage of the propagation-invariant beams[6] and subcellular resolution along the axial direction, plane-illumination by scanning the line created by the Bessel beam across the focal plane of a detection objective limits the light to a thin layer of the sample over a large FOV[7]. However, one problem with the Bessel sheet model is the fluorescence generated by the Bessel sidelobes, which results in the out-of-focus blur, compromises the sectioning ability, and leads to an image with reduced signal-to-noise ratio (SNR)[8]. To address this issue, several methods like deconvolution[9] or confocal-type detection[8,10] have been proposed to remove the background blur. By adapting structured illumination[7,11] or two-photon excitation (TPE)[7] into the LSFM with Bessel beam plane illumination, Betzig and colleagues eliminated the unwanted excitation by the sidelobes, allowing for living cell imaging with a 3D isotropic resolution down to . Considering the limitations of requiring additional acquisition time when structured illumination is applied, using the optical lattices formed by the coherent superposition of Bessel beams as the illumination enables rapid data acquisition and imaging with a negligible background outside of the focal plane in the lattice LSFM[12,13]. Using multiphoton excitation to suppress the Bessel sidelobes has been theoretically and experimentally demonstrated with many successful imaging samples[7,14–16]. However, using the multiphoton method has the problem of photodamage to some extent and is limited to the available fluorophores with large multiphoton cross sections[17]. Recent work used subtraction of the two images obtained by scanning the Bessel beam and its complementary beam to eliminate the out-of-focus signal[18]. In their work, for achieving a complementary beam to excite almost the same out-of-focus signal as the Bessel beam light sheet, the phase function around the annulus is designed by the complex genetic algorithm and is experimentally generated with a spatial light modulator.
In this paper, using the annular vortex phase plate (VPP) to create two Bessel beams with a similar out-of-focus blur, the method of subtractive imaging[19,20] is employed to improve the imaging performance with the suppression of the sidelobes in LSFM with Bessel beam plane illumination. A solid Bessel beam and a ring-like Bessel beam with a hollow hole along the direction of propagation are used for excitation, which results in two LSFM images. Then, by subtraction of these two images, only in-focus fluorescence remains and an LSFM image with the suppression of the sidelobes can be obtained. The ring-like Bessel beam is created by inserting an annular VPP in a left-handed circularly polarized beam. For decreasing or eliminating the image deformations caused by the negative intensity in the subtractive method[21,22], the solid Bessel beam is extended by using the same VPP in a right-handed circularly polarized beam. Therefore, two excitation beams with a similar distribution of the sidelobes and a good matching between the outside profiles of the main lobe of the two point spread functions (PSFs) can be obtained, where the PSF is the respective normalized intensity distribution of the focal spot. We also demonstrate that it is possible to design the numerical aperture (NA) of the annulus so that the two input lasers have better matched distributions between the respective PSF. Therefore, the difference between these two PSFs is a thin single-photon light sheet with a low background and high contrast that enhances the sectioning ability of the system.
Sign up for Chinese Optics Letters TOC. Get the latest issue of Chinese Optics Letters delivered right to you!Sign up now
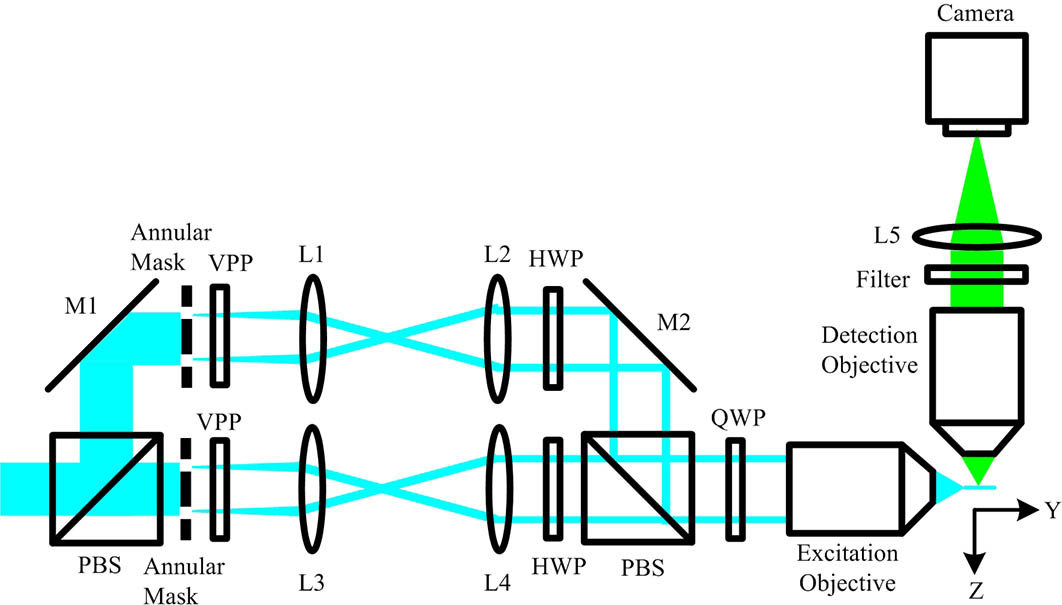
In the proposed imaging method, two excitation beams with the same laser wavelength are used. One beam is a solid light sheet, and the other is a ring-like light-sheet pattern. A schematic view of the optical system of the subtractive Bessel LSFM is shown in Fig. 1. After the laser passes through a polarization beam splitter (PBS), two excitation beams pass through the annular masks to create the light-sheet beams. In one excitation, we produce a Bessel light sheet with a hollow hole along the direction of propagation. For obtaining such a pattern, a VPP with a helical phase ramp with is inserted in a left-handed circularly polarized beam[23–26]. In the other excitation, a Bessel beam with extended solid focus is created by using another VPP in the right-handed circularly polarized beam[22]. In our method, two half-wave plates (HWPs) are inserted in both beams to adjust the polarization and a quarter-wave plate (QWP) is used to generate circular polarization. The two beams are combined by a second PBS and are directed to the excitation objective (). The emission is detected by a perpendicular detection objective (). The product of the illumination and detection PSFs determines the overall PSF of the LSFM system[27]. Therefore, by subtracting for the ring-like light-sheet illumination from for the solid light-sheet illumination. The effective corresponding to the subtractive imaging is expressed as where is the subtraction factor. The and for the LSFM system are obtained by multiplying the intensity PSF of each illumination and the detection PSF[27], which are given by where and are the wavelengths for the excitation and detection, and the optical axis of the detection is chosen as the axis in our calculations.
Figure 1.Schematic diagram of the optical system of a subtractive Bessel LSFM.
According to the vectorial diffraction theory[28–30], the amplitude distribution of the point in the focal region for the circularly polarized beam is expressed as
In the above equation, is the field of the amplitude of the input light. is the conic angle and is the polar coordinate. and are the maximum and minimum angles created by an annular mask, which correspond to the numerical apertures of the annulus of and in the relationship of , where is the refractive index of the focusing medium. is the focal length of the lens. is the wavelength in vacuo and is the wavenumber. is the phase retardation induced by the VPP. In Eq. (4), the positive sign in the column matrix represents the left-handed circularly polarized beam and the minus sign represents the right-handed circularly polarized beam.
In our calculations, for achieving a high axial resolution, an annular mask characterized by and in the ring-like Bessel beam is used. To avoid the deformation of the images caused by a negative intensity in the subtraction between the two excitation images, the outside profiles of the main lobe of the two excitation PSFs should match well[21]. For this reason, our calculation shows that the extended solid spot achieved by using the VPP should be further enlarged by applying the annulus with a smaller NA. Meanwhile, the appropriate NA should be designed to keep the overlap of the sidelobes between the two PSFs as much as possible. Therefore, an annular mask with a slightly smaller NA ( and ) than that of the ring-like Bessel beam is considered in the solid Bessel beam. Since the spatial resolution and the extension along the propagation are strongly dependent on the dark spot size of the hollow Bessel beam in the subtraction imaging, applying an annular mask with a slightly lower in the solid Bessel beam does not degrade the axial resolution and change the FOV. At the very start, it is helpful to analyze the two illumination PSFs. Figure 2 shows the calculated intensity distributions of two Bessel beams in the plane and in the plane. Here, we choose a wavelength of as the excitation wavelength. From the intensity profiles shown in Fig. 2(e), we can find that the distributions of the sidelobe are almost identical and the outside profiles of the main lobe of the PSFs match well. Specifically, the first sidelobes overlap well. Therefore, the two images with similar out-of-focus blur can be obtained. By subtracting between the two images, an improved image with the suppression of the sidelobes can be expected.
Figure 2.Calculated intensity distributions of (a), (c) the extended Bessel light-sheet beam and (b), (d) the ring-like Bessel light-sheet beam (a), (b) in the plane with and (c), (d) in the plane with . (e) The normalized line profiles of the intensity distributions along the central axis in (c) and (d).
To verify this conclusion, the effective PSF of the system is calculated by using Eq. (1). The resulting PSF in the plane for the subtractive Bessel light-sheet fluorescence microscopy is shown in Fig. 3(d). In the calculation, a wavelength of as the fluorescence wavelength is assumed and the detection PSF in the plane is also displayed in Fig. 3(b). The subtraction factor is used to maintain the same axial resolution as the conventional Bessel light-sheet fluorescence microscopy, where the axial resolution (full width at half-maximum, FWHM) is 280 nm. In this conventional Bessel LSFM, the same annular mask characterized with and is used and no VPP is inserted in the right-handed circularly polarized beam. The calculated illumination PSF is shown is Fig. 3(a) and, by multiplying this illumination PSF with the detection PSF shown in Fig. 3(b), the obtained system PSF for the conventional Bessel LSFM is displayed in Fig. 3(c). The central intensity profiles along the axis in Figs. 3(c) and 3(d) are shown in Fig. 3(e). Compared with the data of the conventional Bessel light-sheet microscopy, the sidelobes are significantly suppressed and, specifically, the first sidelobe is decreased from 13.88% to of the peak while maintaining the axial resolution unchanged.
Figure 3.PSFs of the light-sheet microscopy in the plane. (a) The calculated illumination PSF for the conventional Bessel LSFM with an annular mask characterized by and . (b) The detection PSF with . (c) The system PSF for the conventional Bessel LSFM. (d) The system PSF for subtractive Bessel LSFM obtained with extended solid Bessel beam with an annular mask characterized by and and a ring-like Bessel beam with an annular mask characterized by and . (e) The normalized line profiles of the intensity distributions along the central axis in (c) and (d).
For the simulation test in imaging, a sample pattern consisting of 16 points is used. The spacing between the two points is 315 nm along the direction and 500 nm along the direction, as shown in Fig. 4(a). The size of each point is 20 nm. The simulated conventional Bessel LSFM image is shown in Fig. 4(b) and the simulated subtractive Bessel LSFM image is shown in Fig. 4(c). The simulations are calculated by the convolution integral of their respective system PSF with the object image. It is obvious that the points can be distinguishable with a higher contrast and a better SNR in Fig. 4(c). The points in the middle domain are obscured in Fig. 4(b) because of the artifacts that have arisen by the higher sidelobes. The subtractive Bessel LSFM clearly demonstrates better performance than the conventional Bessel LSFM.
Figure 4.Simulated images of a sample consisting of 16 points shown in (a) for (b) the conventional Bessel LSFM and (c) the subtractive Bessel LSFM.
Therefore, if the subtractive Bessel LSFM and conventional Bessel LSFM are of the same resolution, less artifacts occur in the subtractive Bessel LSFM imaging. Another sample pattern consisting of an array of parallel lines with smaller spacing is designed for the simulation test, which is shown in Fig. 5(a). The linewidth is 15 nm and the distance between two adjacent lines is 305 nm. The simulation image is obtained by the convolution integral of with the object image, as shown in Fig. 5(c). For comparison, the corresponding image achieved by the conventional Bessel LSFM is shown in Fig. 5(b). Because of the “edge effect” caused by sidelobes, the resulting artifacts blur the images of the two lines in the middle in Fig. 5(b). Meanwhile, the four lines still can be resolved in Fig. 5(c). Figure 5(d) shows the central intensity profiles along the axis in Figs. 5(a)–(c), where the profile of the subtractive Bessel LSFM displays more pronounced peaks and valleys. Therefore, the resulting suppression of the out-of-focus background could have a better performance in the densely fluorescent specimens.
Figure 5.Simulated images of a sample consisting of four parallel lines shown in (a) for (b) the conventional Bessel LSFM and (c) the subtractive Bessel LSFM. (d) The central line profiles of the intensity along the axis in (a), (b), and (c).
In summary, we propose applying the subtraction method in light-sheet microscopy with Bessel beam plane illumination to generate a thin single-photon light sheet with suppression of the sidelobes, which enhances the sectioning ability and the contrast of the LSFM. In this method, by using the commercial VPPs, two complementary Bessel beams with similar out-of-focus blur can be achieved. Therefore, the subtraction between these two images excited by an extended solid Bessel beam and a ring-like Bessel beam suppresses the sidelobes. The image processing is quite simple. This subtraction imaging in the LSFM is expected to be a robust and simpler method to promote the adaption of the nondiffracting beam modes like the Bessel beam in LSFM to deliver subcellular isotropic resolution over a large volume imaging. The resulting suppression of out-of-focus background would help to extend cellular imaging to densely fluorescent specimens, which exactly meets the requirement of future light-sheet engineering in the applications of the life sciences.