
Ya-li DENG, Mei LI, Ming WANG, Hui HAO, Wei XIA. Surface Plasmon Resonance Gas Sensor Based on Silver/Titanium Dioxide Composite Film[J]. Spectroscopy and Spectral Analysis, 2022, 42(3): 743
- Spectroscopy and Spectral Analysis
- Vol. 42, Issue 3, 743 (2022)
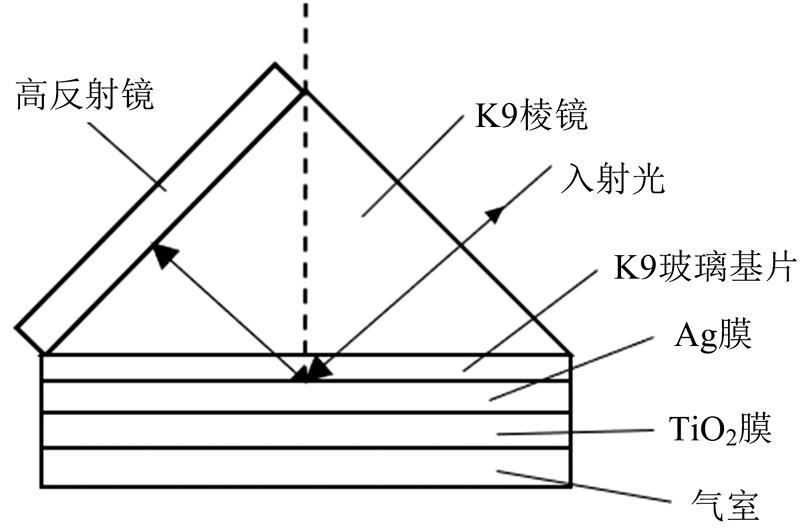
Fig. 1. Four-layer Kretschmann prism coupling SPR sensing structure
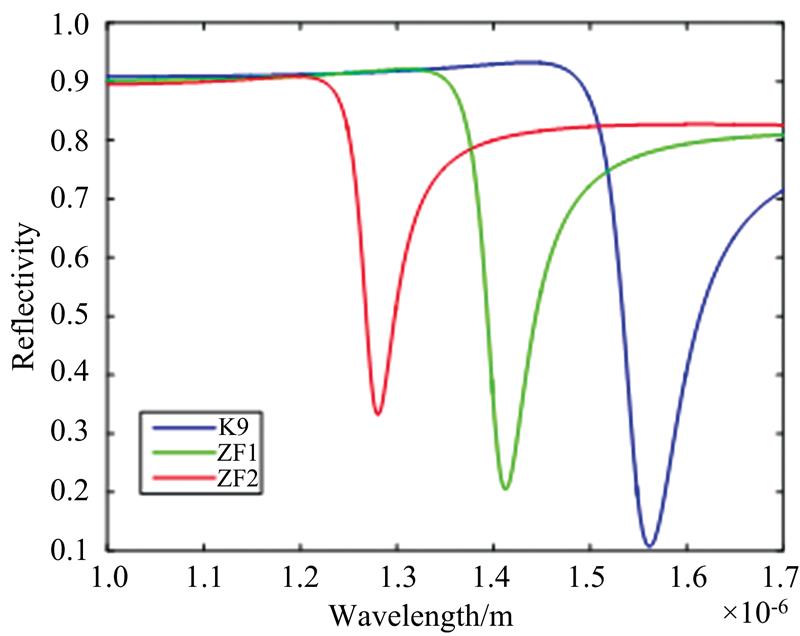
Fig. 2. The Reflecting spectra for different prisms
Fig. 3. The influence of different Ag film thickness on SPR resonance spectra
Fig. 4. The effect of TiO2 thickness on SPR resonance
(a): Ag=45 nm; (b): 50 nm
(a): Ag=45 nm; (b): 50 nm
Fig. 5. The reflectance spectrum of the sensor under different environmental refractive indexes
(a): 45 nm Ag/110 nm TiO2; (b): 50 nm Ag/110 nm TiO2
(a): 45 nm Ag/110 nm TiO2; (b): 50 nm Ag/110 nm TiO2
Fig. 6. The relationship between the position of the SPR resonance valley and the refractive index of the environment
Fig. 7. (a) Schematic diagram of SPR resonance gas sensor based on waveleogth interrogation; (b) The experimental setup SPR resonance gas sensor
Fig. 8. Spectra of different hydrogen concentrations
Fig. 9. The relationship between the trough position and the hydrogen concentration
Fig. 10. Linear fitting diagram of SPR resonance valley wavelength and gas concentration

Set citation alerts for the article
Please enter your email address
© Copyright 2018-2021 | Chinese Laser Press. All Rights Reserved 沪ICP备15018463号-20