• Chinese Optics Letters
  • Vol. 18, Issue 5, 051401 (2020)
Kangwen Yang1, Hai Li1, Hang Gong1, Xuling Shen2, Qiang Hao1, Ming Yan2, Kun Huang1, and Heping Zeng1、2、*
Author Affiliations
  • 1Shanghai Key Laboratory of Modern Optical System, Engineering Research Center of Optical Instrument and System, Ministry of Education, School of Optical-Electrical and Computer Engineering, University of Shanghai for Science and Technology, Shanghai 200093, China
  • 2State Key Laboratory of Precision Spectroscopy, East China Normal University, Shanghai 200062, China
  • show less
    DOI: 10.3788/COL202018.051401 Cite this Article Set citation alerts
    Kangwen Yang, Hai Li, Hang Gong, Xuling Shen, Qiang Hao, Ming Yan, Kun Huang, Heping Zeng. Temperature measurement based on adaptive dual-comb absorption spectral detection[J]. Chinese Optics Letters, 2020, 18(5): 051401 Copy Citation Text show less
    (a) Line strength at different temperatures for each line. (b) Line strength ratio and relative sensitivity of target lines at different temperatures.
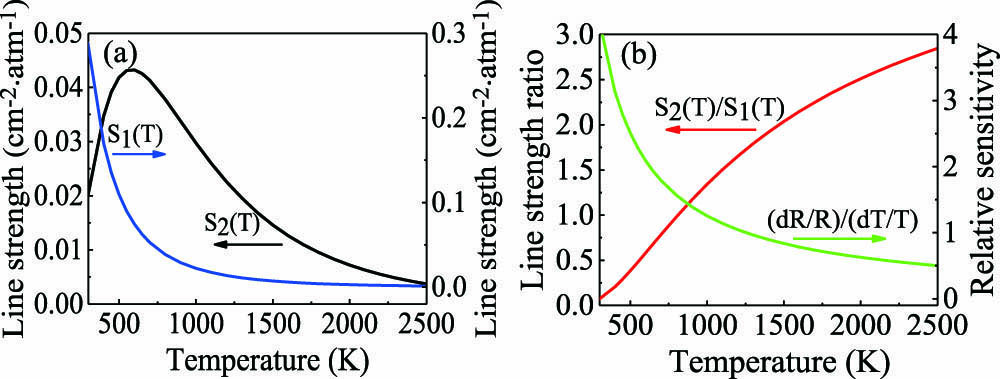
    Fig. 1. (a) Line strength at different temperatures for each line. (b) Line strength ratio and relative sensitivity of target lines at different temperatures.
    Experimental setup. EDFA: erbium-doped optical fiber amplifier; HNLF: highly nonlinear fiber; BPF: bandpass filter; CP: coupler; ACS: asynchronous clock signal; PES: phase error signal; FAC: fast acquisition card; CLK: clock; CH: signal input channel; M: mixer.
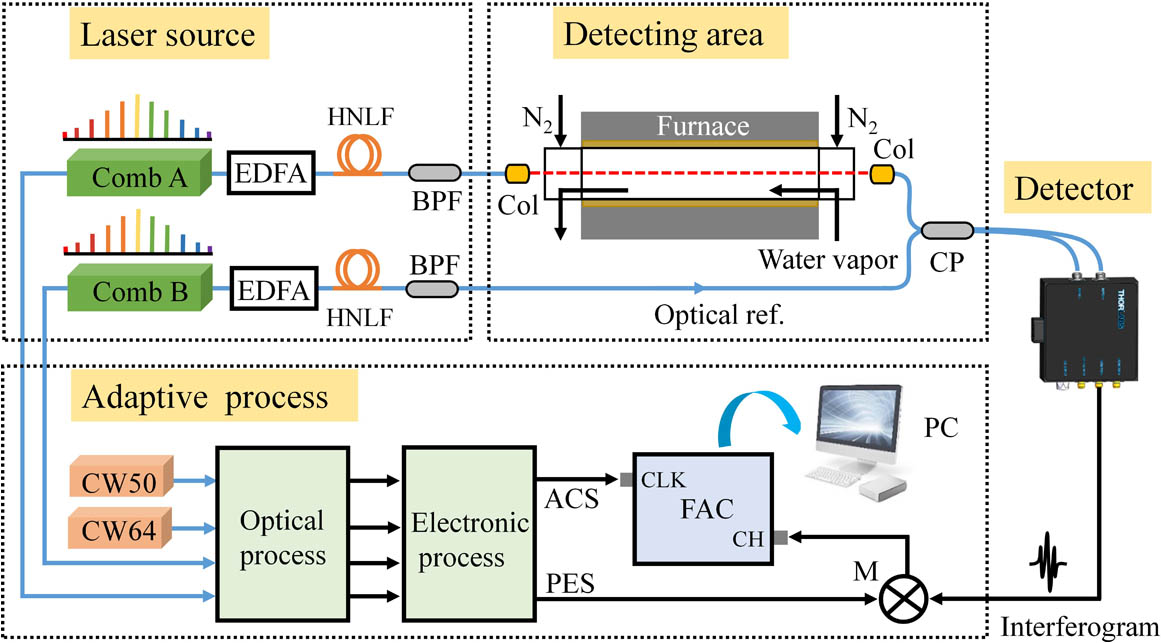
    Fig. 2. Experimental setup. EDFA: erbium-doped optical fiber amplifier; HNLF: highly nonlinear fiber; BPF: bandpass filter; CP: coupler; ACS: asynchronous clock signal; PES: phase error signal; FAC: fast acquisition card; CLK: clock; CH: signal input channel; M: mixer.
    Spectra of two combs from the fiber oscillator (gray solid line), broadening spectra after the highly nonlinear fibers (blue dotted line), and filtered spectra (red area) for (a) comb and (b) comb B respectively.
    Fig. 3. Spectra of two combs from the fiber oscillator (gray solid line), broadening spectra after the highly nonlinear fibers (blue dotted line), and filtered spectra (red area) for (a) comb and (b) comb B respectively.
    (a) Dual-comb interferograms of a single measurement (black) and 3×10³-fold time-domain averaging (pink). (b) Comparison of the absorption line of water vapor at 296 K with the HITRAN database.
    Fig. 4. (a) Dual-comb interferograms of a single measurement (black) and 3×10³-fold time-domain averaging (pink). (b) Comparison of the absorption line of water vapor at 296 K with the HITRAN database.
    Multiple-peak Voigt fit (solid line) to the measured spectral absorbance (dotted line) at different temperatures. The corresponding relative residuals normalized to the peak value of the respective fitting curve are shown on the top panel with a range from −10% to 10%.
    Fig. 5. Multiple-peak Voigt fit (solid line) to the measured spectral absorbance (dotted line) at different temperatures. The corresponding relative residuals normalized to the peak value of the respective fitting curve are shown on the top panel with a range from −10% to 10%.
    Line indexWavenumber ν(cm1)Line strength at 296 K (cm2·atm1)E(cm1)
    17168.4370.29173.366
    27185.5971.96×1021045.058
    Table 1. Parameters of the Two Target Lines for Simulation and Experiment
    Setting temperature (K)Average temperature (K)Calculated temperature (K)Relative deviation δ (%)
    500465.2476.12.34
    600559.4574.82.75
    700645.7666.23.17
    800733.4755.02.94
    900810.3846.94.51
    1000891.5935.54.93
    Table 2. Detailed Comparison Between Measured Temperature and Setting Temperature
    Kangwen Yang, Hai Li, Hang Gong, Xuling Shen, Qiang Hao, Ming Yan, Kun Huang, Heping Zeng. Temperature measurement based on adaptive dual-comb absorption spectral detection[J]. Chinese Optics Letters, 2020, 18(5): 051401
    Download Citation