1Shanghai Key Laboratory of Modern Optical System, Engineering Research Center of Optical Instrument and System, Ministry of Education, School of Optical-Electrical and Computer Engineering, University of Shanghai for Science and Technology, Shanghai 200093, China
2State Key Laboratory of Precision Spectroscopy, East China Normal University, Shanghai 200062, China
Kangwen Yang, Hai Li, Hang Gong, Xuling Shen, Qiang Hao, Ming Yan, Kun Huang, Heping Zeng. Temperature measurement based on adaptive dual-comb absorption spectral detection[J]. Chinese Optics Letters, 2020, 18(5): 051401
Copy Citation Text
We demonstrate absorption spectroscopy of water vapor for the determination of gas temperature. An adaptive dual-comb detection system is utilized to obtain precise spectroscopic data in a broadband range from 7143 to 7240 cm?1 with a spectral resolution of 0.049 cm?1. The measured spectra are in accordance with the simulated results from the HITRAN (high-resolution transmission molecular absorption) database. Several measurements are investigated in the temperature range of 500–1000 K, revealing relative deviations of less than 5% compared to the thermocouple. This broadband and accurate adaptive dual-comb spectral detection method could be a powerful tool for non-invasive combustion diagnosis.
Measuring the exhaust-gas temperature fast and accurately would be of great help for inferring the combustion efficiency of engines and gas turbines. The traditional measurement tools are thermocouples with a cheap price and a high accuracy. However, the slow response and inevitable interference in the combustion limit their applications. As an alternative, laser absorption spectroscopy provides a fast, non-invasive, and reliable method for measuring multiple parameters such as temperature, pressure, and species concentrations[1,2]. Therein, tunable diode laser absorption spectroscopy (TDLAS) has been widely used due to its simple setup, remote sensing capability, high signal-to-noise ratio (SNR), and fast measuring speed[3–6]. However, due to the narrow bandwidth of the diode laser, a combination of diode lasers with different wavelengths and various modulation strategies is needed to obtain spectroscopic data with a broadband range and a high resolution[7–10].
Dual-comb spectroscopy (DCS) has been developed rapidly in many research fields including precision spectroscopy, atmospheric sensing, and biomedical diagnostics owing to the unprecedented performance of fast acquisition speed, high resolution, and broad spectral range[11–17]. This method has already been used in diagnosing gas turbine exhaust in industrial applications[18]. Spectra of pure water vapor at a high temperature in a spectral range from have been reported with high accuracy[19]. Recently, DCS has been adopted to compare the high temperature performance of the high-resolution transmission molecular absorption (HITRAN) and high-temperature molecular spectroscopic (HITEMP) databases, showing its broadband measuring range and high spectral resolution[20–23]. However, using DCS for precision measurements in complex environments is hindered by the difficulty of tight stabilization of both the repetition rate and carrier-envelope phase for two ultrashort lasers. Several approaches are presented to solve this problem by using a microresonator[24], a free-running semiconductor disk laser[25], or electro-optic modulators[26,27]. As an alternative, adaptive dual-comb spectroscopy (ADCS) only uses free-running mode-locked lasers without any phase-locked electronics, and thus becomes an accessible and robust technique for precision measurement[28,29]. This method has been used from visible, infrared, to even terahertz spectral ranges with a fast speed and a high accuracy[30–34]. Recently, we have realized the long-term stabilization of an ADCS system for over 1200 h, showing its robustness for absorption spectroscopy[35]. Based on this system and a phase-shifted fiber Bragg grating, rapid thermal sensors with a thermal measurement resolution of 0.01 K have been reported[36]. In this Letter, we extend the spectral range of an ADCS system from 1520–1540 nm to 1380–1400 nm via high nonlinear fibers and measure the absorption lines of water vapor in the temperature range of 500–1000 K. The measured spectra fit well with the theoretical expectation from the HITRAN database. Using these spectra, the sample temperature is calculated by two-line thermometry, verifying that this method could be used for combustion diagnosis.
According to the Beer–Lambert law, the relationship between the initial laser intensity and the laser intensity can be expressed as where [atm] is the local total pressure, is the molar fraction of the species, is the line strength of the transition at temperature , [cm] is the line-sharp function, and [cm] is the optical path length.
Sign up for Chinese Optics Letters TOC. Get the latest issue of Chinese Optics Letters delivered right to you!Sign up now
For two-line thermometry, the temperature can be deduced by the ratio of two temperature-dependent line strengths. In the condition of the same pressure, the same path length, and the same mole fraction, the ratio of the line strength equals that of the integral absorbance , where [J·s] is Planck’s constant, is the speed of light, is Boltzmann’s constant, is the lower-state energy of the transition, and is the reference temperature. The temperature can be:
In this case, the relative sensitivity of the temperature measurement can be derived from Eq. (2) as:
From Eq. (4), in order to ensure a high relative sensitivity during measurement, line pairs with large energy differences should be selected.
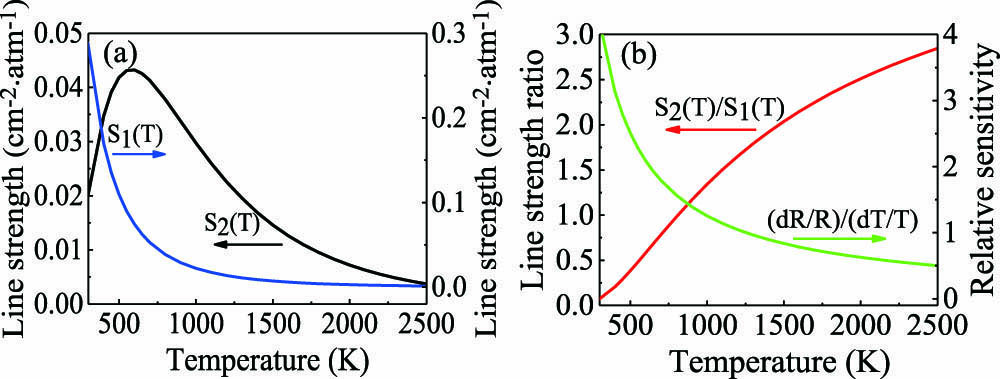
The line selection criteria for the two-line thermometry have been discussed[37]. Based on that, we decided to use two lines at 7168.437 and . The corresponding parameters are given in Table 1 (, ). According to the HITRAN database, the line strength at different temperatures for each line is shown in Fig. 1(a). The relationship between the line strength ratio and the temperature can be calculated, as shown in Fig. 1(b). The relative sensitivity curve of the target line pair is also shown in Fig. 1(b), which is obtained from Eq. (4). The results show that the selected two target lines have a good temperature sensitivity in a given temperature range.
Line index
Wavenumber ν(cm−1)
Line strength at 296 K (cm−2·atm−1)
E″(cm−1)
1
7168.437
0.29
173.366
2
7185.597
1.96×10⁻²
1045.058
Table 1. Parameters of the Two Target Lines for Simulation and Experiment
Figure 1.(a) Line strength at different temperatures for each line. (b) Line strength ratio and relative sensitivity of target lines at different temperatures.
The experimental setup consists of four main components, namely, the laser source, the detecting area, the detector, and the adaptive process, as shown in Fig. 2. The laser source is a pair of Er-doped fiber lasers with a slight repetition rate difference of around 66.14 MHz (denoted as combs A and B). The two combs generate repetitive pulses with central wavelengths of 1550 nm and spectral bandwidths of . These pulses are then amplified to average powers of 200 mW with pulse durations of less than 150 fs. By utilizing a piece of 15 cm highly nonlinear fiber (HNLF) after each amplifier, the output spectrum of either comb A or B can be broadened to cover the absorption spectral range of water vapor, as shown in Figs. 3(a) and 3(b). Two fiber-pigtail bandpass filters with bandwidths of 20 nm are used after the HNLFs. The filtered laser pulses from comb A are injected to the detecting area via a fiber collimator while those from comb B are sent to one input branch of a 1:1 fiber coupler as the reference. The detecting area is formed by a 50 cm long gas cell inserted into a tube furnace with a temperature range from 300 to 1000 K; an S-type thermocouple is already integrated inside the furnace. The laser pulses pass through the central area of the furnace and are then coupled into the other input branch of the 1:1 fiber coupler by a fiber collimator. The total optical length containing water vapor is 40 cm. The fiber coupler is used to combine the laser pulses from combs A and B, which are then sent to the detector (PDB410C, Thorlabs) of our system to obtain the optical multi-heterodyne signal.
Figure 3.Spectra of two combs from the fiber oscillator (gray solid line), broadening spectra after the highly nonlinear fibers (blue dotted line), and filtered spectra (red area) for (a) comb and (b) comb B respectively.
The adaptive process contains both optical and electronic processes. The detailed information can be found in our previous Letter[35]. In simple terms, the optical process employs two continuous wave (CW) lasers (denoted as CW50 and CW64) centered at 1550 and 1564 nm to beat with both combs and generate four beat signals. These four signals are frequency mixed, shifted, doubled, and filtered by the electronics to generate two adaptive signals. One adaptive signal is called the phase error signal (PES), which is used to mix with the multi-heterodyne signal from the detector. The other adaptive signal is called the asynchronous clock signal (ACS). A fast acquisition card (ATS9462, 16 bit, AlazarTech) is clocked by the asynchronous signal and then digitizes the mixed multi-heterodyne signal. By doing this, the relative timing jitter between the two combs is well compensated.
For a typical measurement, the gas cell is filled with water vapor at a pressure of 90 kPa at room temperature. When the gas cell is filled completely, it is sealed and placed at the center of the tube furnace. Then the optical pulses passing through the gas cell are collected and the heterodyne signal is recorded. As for the high-temperature measurement, we just change the setting temperature of the tube furnace. Once the temperature reaches equilibrium, we start to record the heterodyne signal at a higher temperature. In order to avoid environmental interference of low-temperature air, nitrogen protection is used to flush both ends of the gas cell.
In order to verify the high spectral resolution of the adaptive dual-comb system, measurement at room temperature is conducted. The difference in the repetition rate is set to 180 Hz, corresponding to a measuring time for single interferogram of 5.56 ms. Only a 0.3 ms acquisition time is enough to reveal the spectrum from the temporal interferogram. As shown in Fig. 4(a), the SNR is about 40 for a single temporal interferogram. Due to the coherent averaging capability of our adaptive dual-comb, three thousand successive interferograms can be added in real time and thus the SNR is improved to 1400. After that, the time-domain co-added beat signal undergoes Fourier transform to obtain the spectrum in the optical frequency domain. In Fig. 4(b), the absorption lines of water vapor from 7143 to (214.142–217.050 THz) are shown. The spectral resolution in the optical frequency domain is 1.46 GHz, which is enough to reveal the typical absorption lines of water vapor with line widths of several GHz. Figure 4(b) also shows a simulated spectrum for water vapor absorption lines in this region based on parameters provided by the HITRAN. The position and strength of the absorption lines from our measurement fit well with the simulated prediction.
Figure 4.(a) Dual-comb interferograms of a single measurement (black) and -fold time-domain averaging (pink). (b) Comparison of the absorption line of water vapor at 296 K with the HITRAN database.
For evaluation of high temperature performance of our adaptive dual-comb system, spectral data of the absorption lines for the tube furnace from 500–1000 K are recorded, as shown in Fig. 5. The measured two absorption lines centered at 7168.437 and used for two-line thermometry are fitted by Voigt functions; the corresponding relative residual between the measured peak and simulated curve is shown on the top panel for each temperature. Then the area of each curve is integrated and their ratio is used to calculate the temperature. Due to the uneven temperature distribution of the tube furnace, the actual temperature inside the tube furnace is not equal to the setting value. We have measured the temperature along the optical path inside the tube furnace with another S-type thermocouple. It shows a parabolic distribution. Therefore, we give an average value for each setting temperature, considering this parabolic distribution for comparison, which is closer to the actual experimental conditions.
Figure 5.Multiple-peak Voigt fit (solid line) to the measured spectral absorbance (dotted line) at different temperatures. The corresponding relative residuals normalized to the peak value of the respective fitting curve are shown on the top panel with a range from −10% to 10%.
Compared to the average temperature of the tube furnace, the calculated result is consistent with the trend of the setting value albeit a slight increase of the calculated temperature. The detailed calculated values and relative deviations are summarized in Table 2. With the increase of the setting temperature, the relative deviation of the measured result gradually increases. When the setting value reaches 1000 K, the calculated temperature is 935.5 K, resulting in the largest deviation of 4.93% in our measurement.
Setting temperature (K)
Average temperature (K)
Calculated temperature (K)
Relative deviation δ (%)
500
465.2
476.1
2.34
600
559.4
574.8
2.75
700
645.7
666.2
3.17
800
733.4
755.0
2.94
900
810.3
846.9
4.51
1000
891.5
935.5
4.93
Table 2. Detailed Comparison Between Measured Temperature and Setting Temperature
The spectral resolution and SNR can affect the uncertainty for temperature measurement. In general, a higher spectral resolution would benefit with more accurate identification of absorption lines. In our experiment, the resolution of the ADCS (1.46 GHz) is much better than the absorption linewidth (), and further improvement of resolution becomes less important. As for the SNR, it indeed plays a key role in temperature measurement, since it is directly linked to the fitting of the absorption lines and the accuracy of the retrieved line positions. We calculated a relative deviation of temperature versus SNR at 500 K. The relative deviations were 6.39%, 2.89%, and 2.34% for SNRs of 740, 1204, and 1400, corresponding to 1000, 2000, and 3000 averaging interferograms, respectively.
There are several possible reasons for the temperature measuring error. First, there is still a low temperature zone. With the increase of the temperature, the low temperature zones at the two ends would affect the measured result more severely. Second, there might be some water vapor that is not completely eliminated. These residual low temperature gases would introduce a measuring error. The instability of the optical beam and the error in the bimodal Voigt fitting process would also partially contribute to the temperature measuring error.
In conclusion, we have demonstrated temperature measurement using the adaptive dual-comb system and two-line thermometry. The system is capable of measuring a broadband absorption spectrum of almost with a high spectral resolution at the GHz level. The measured spectral data of the water vapor are generally consistent with the HITRAN database. Compared to the setting temperature, the maximum relative deviation of the measured results in the range of 500–1000 K is less than 5%, which is so far mostly limited by the SNR of the spectral lines. By further improvement of the spectral SNR with a multi-pass optical path or enhanced cavity[33], higher accuracy would be achieved with multi-line fitting. The ADCS system meets the requirement of fast speed and high-resolution measurement of temperature in high temperature environments. This method provides a new technical means for non-invasive and accurate measurement of temperature.
Kangwen Yang, Hai Li, Hang Gong, Xuling Shen, Qiang Hao, Ming Yan, Kun Huang, Heping Zeng. Temperature measurement based on adaptive dual-comb absorption spectral detection[J]. Chinese Optics Letters, 2020, 18(5): 051401