
Jiaqi Zhang, Yunqi Liu, Shaoxiong He, Ben Liu, Zongtao Zhu. Ultrasonic Vibration Steel/Aluminum Butt Joints by Laser-MIG Hybrid Fusion-Brazing Welding[J]. Chinese Journal of Lasers, 2022, 49(16): 1602013
- Chinese Journal of Lasers
- Vol. 49, Issue 16, 1602013 (2022)
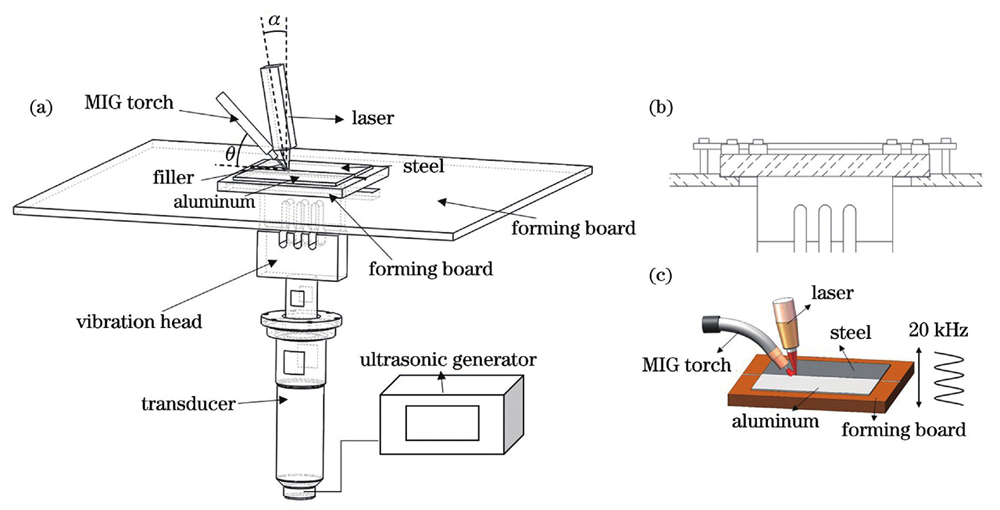
Fig. 1. Ultrasonic-assisted laser-MIG hybrid welding. (a) Schematic of equipment; (b) sectional view of partial assembly;(c) schematic of welding
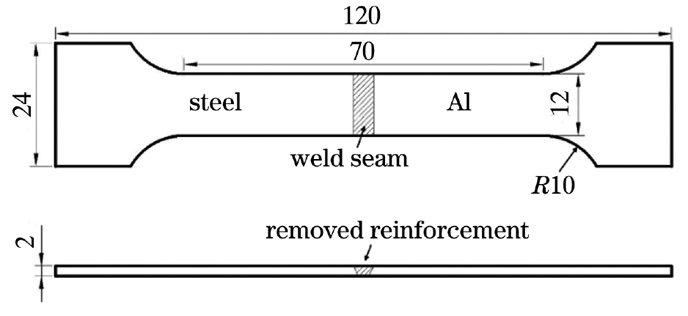
Fig. 2. Dimension diagram of tensile specimen (unit: mm)
Fig. 3. Front and back sides (left) and macro-forming (right) of welded joints under different ultrasonic powers. (a1)-(a3) 0 W; (b1)-(b3) 130140 W; (c1)-(c3) 200210 W
Fig. 4. Structures of middle areas of joint welds and welds near fusion line at aluminum side under different ultrasonic powers. (a)(d) 0 W; (b)(e) 130-140 W; (c)(f) 200-210 W
Fig. 5. Microstructures of IMCs at steel/ aluminum interface and EDS line scanning results under different ultrasonic powers. (a)(b) 0 W; (c)(d) 130140 W; (e)(f) 200210 W
Fig. 6. Hardness distributions of welded joints under different ultrasonic powers
Fig. 7. Tensile strengths of joints after removing reinforcement under different ultrasonic powers
Fig. 8. Tensile fracture morphologies of specimens after removing reinforcement under different ultrasonic powers
|
Table 1. Chemical compositions of base metal and welding wire (mass fraction, %)
|
Table 2. Parameters for ultrasonic-assisted laser-MIG hybrid welding
|
Table 3. EDS point scanning analysis results at locations AH in Fig. 5
|
Table 4. Average hardness of each area of joints under different ultrasonic powers
|
Table 5. EDS point scanning analysis results at locations 114 in Fig. 8

Set citation alerts for the article
Please enter your email address
© Copyright 2018-2021 | Chinese Laser Press. All Rights Reserved 沪ICP备15018463号-20