
Wei GAO, Meimei LIN, Yongrong HUANG, Shide HUANG, Gongfu YE, Zhiqun HUANG. Effects of Forest Types and Environmental Factors on Soil Microbial Biomass in a Coastal Sand Dune of Subtropical China[J]. Journal of Resources and Ecology, 2020, 11(5): 454
- Journal of Resources and Ecology
- Vol. 11, Issue 5, 454 (2020)
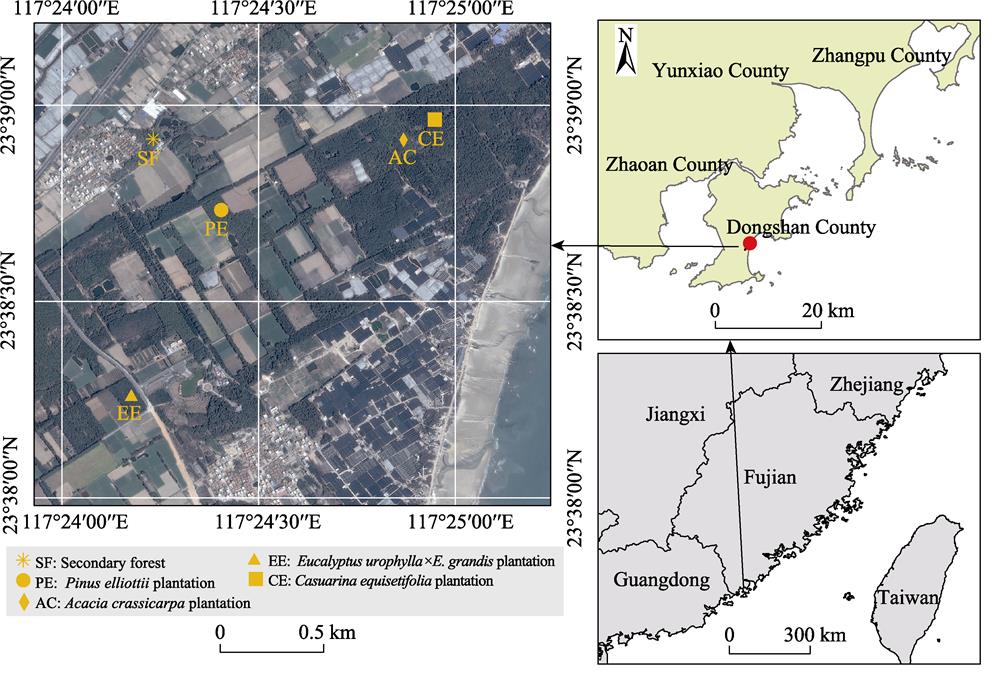
Fig. 1. Fig. 1
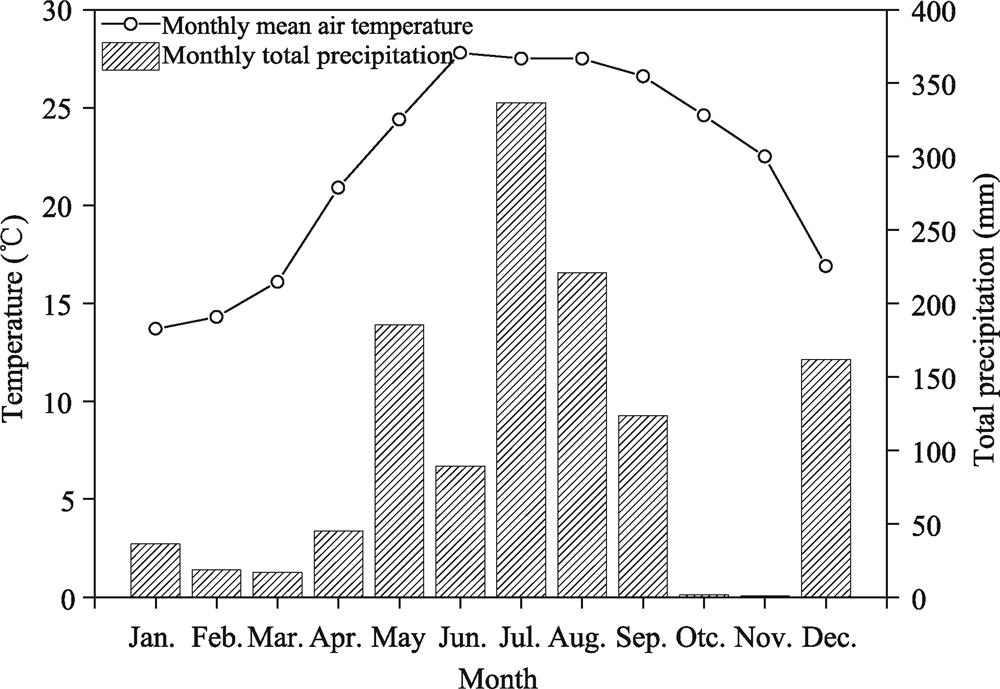
Fig. 2. Fig. 2
Fig. 3. Fig. 3
Fig. 4. Fig. 4
Fig. 5. Fig. 5
Fig. 6. Fig. 6
Fig. 7. Fig. 7
|
Table 1.
Detailed site characteristics and topsoil properties of the five forest stands on the southeastern coast of China
|
Table 2.
Soil pH, soil bulk density, soil C and N content, and soil C: N ratio for the different forests (N=4)
| ||||||||||||||||||||||||||||||||||||||||||||||||||||||||||||||
Table 3.
Pearson correlations between seasonal variations of soil MBC and MBN and soil temperature as well as water content
|
Table 4.
Pearson correlations between soil MBC and MBN and properties of soil, litter and fine roots

Set citation alerts for the article
Please enter your email address
© Copyright 2018-2021 | Chinese Laser Press. All Rights Reserved 沪ICP备15018463号-20