• Advanced Photonics
  • Vol. 1, Issue 2, 025001 (2019)
Shijie Feng1、2、3, Qian Chen1、2、*, Guohua Gu1、2, Tianyang Tao1、2, Liang Zhang1、2、3, Yan Hu1、2、3, Wei Yin1、2、3, and Chao Zuo1、2、3、*
Author Affiliations
  • 1Nanjing University of Science and Technology, School of Electronic and Optical Engineering, Nanjing, China
  • 2Jiangsu Key Laboratory of Spectral Imaging and Intelligent Sense, Nanjing, China
  • 3Nanjing University of Science and Technology, Smart Computational Imaging Laboratory (SCILab), Nanjing, China
  • show less
    DOI: 10.1117/1.AP.1.2.025001 Cite this Article Set citation alerts
    Shijie Feng, Qian Chen, Guohua Gu, Tianyang Tao, Liang Zhang, Yan Hu, Wei Yin, Chao Zuo. Fringe pattern analysis using deep learning[J]. Advanced Photonics, 2019, 1(2): 025001 Copy Citation Text show less
    Flowchart of the proposed method where two convolutional networks (CNN1 and CNN2) and the arctangent function are used together to determine the phase distribution. For CNN1 (in red), the input is the fringe image I(x,y), and the output is the estimated background image A(x,y). For CNN2 (in green), the inputs are the fringe image I(x,y) and the background image A(x,y) predicted by CNN1, and the outputs are the numerator M(x,y) and the denominator D(x,y). The numerator and denominator are then fed into the arctangent function to calculate the phase ϕ(x,y).
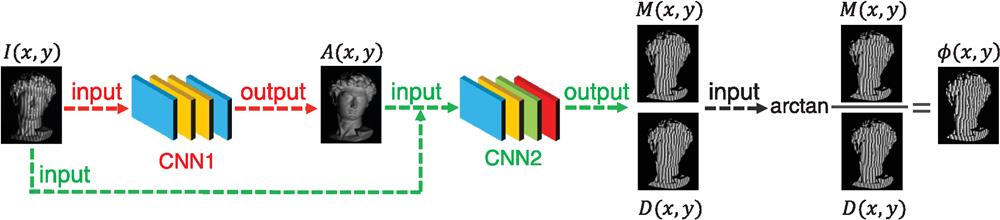
    Fig. 1. Flowchart of the proposed method where two convolutional networks (CNN1 and CNN2) and the arctangent function are used together to determine the phase distribution. For CNN1 (in red), the input is the fringe image I(x,y), and the output is the estimated background image A(x,y). For CNN2 (in green), the inputs are the fringe image I(x,y) and the background image A(x,y) predicted by CNN1, and the outputs are the numerator M(x,y) and the denominator D(x,y). The numerator and denominator are then fed into the arctangent function to calculate the phase ϕ(x,y).
    Schematic of CNN1, which is composed of convolutional layers and several residual blocks.
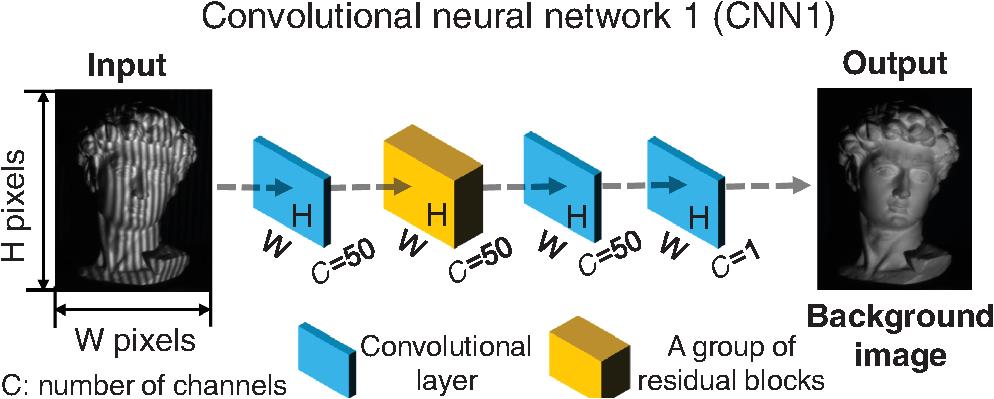
    Fig. 2. Schematic of CNN1, which is composed of convolutional layers and several residual blocks.
    Schematic of CNN2, which is more sophisticated than CNN1 and further includes two pooling layers, an upsampling layer, a concatenation block, and a linearly activated convolutional layer.
    Fig. 3. Schematic of CNN2, which is more sophisticated than CNN1 and further includes two pooling layers, an upsampling layer, a concatenation block, and a linearly activated convolutional layer.
    Testing using the trained networks on a scene that is not present in the training phase. (a) Input fringe image I(x,y), (b) background image A(x,y) predicted by CNN1, (c) and (d) numerator M(x,y) and denominator D(x,y) estimated by CNN2, (e) phase ϕ(x,y) calculated with (c) and (d).
    Fig. 4. Testing using the trained networks on a scene that is not present in the training phase. (a) Input fringe image I(x,y), (b) background image A(x,y) predicted by CNN1, (c) and (d) numerator M(x,y) and denominator D(x,y) estimated by CNN2, (e) phase ϕ(x,y) calculated with (c) and (d).
    Comparison of the phase error of different methods: (a) FT, (b) WFT, (c) our method, and (d) magnified views of the phase error for two selected complex regions.
    Fig. 5. Comparison of the phase error of different methods: (a) FT, (b) WFT, (c) our method, and (d) magnified views of the phase error for two selected complex regions.
    Comparison of the 3-D reconstruction results for different methods: (a) FT, (b) WFT, (c) our method, and (d) ground truth obtained by the 12-step PS profilometry.
    Fig. 6. Comparison of the 3-D reconstruction results for different methods: (a) FT, (b) WFT, (c) our method, and (d) ground truth obtained by the 12-step PS profilometry.
    Quantitative analysis of the reconstruction accuracy of the proposed method. (a) Measured objects: a pair of standard spheres and (b) 3-D reconstruction result showing the measurement accuracy.
    Fig. 7. Quantitative analysis of the reconstruction accuracy of the proposed method. (a) Measured objects: a pair of standard spheres and (b) 3-D reconstruction result showing the measurement accuracy.
    MethodFTWFTOur
    MAE (rad)0.200.190.087
    Table 1. Phase error of FT, WFT, and our method.
    Shijie Feng, Qian Chen, Guohua Gu, Tianyang Tao, Liang Zhang, Yan Hu, Wei Yin, Chao Zuo. Fringe pattern analysis using deep learning[J]. Advanced Photonics, 2019, 1(2): 025001
    Download Citation