
Lin WU, Minglei HU, Liping WANG, Shaomeng HUANG, Xiangyuan ZHOU. Preparation of TiHAP@g-C3N4 Heterojunction and Photocatalytic Degradation of Methyl Orange [J]. Journal of Inorganic Materials, 2023, 38(5): 503
- Journal of Inorganic Materials
- Vol. 38, Issue 5, 503 (2023)
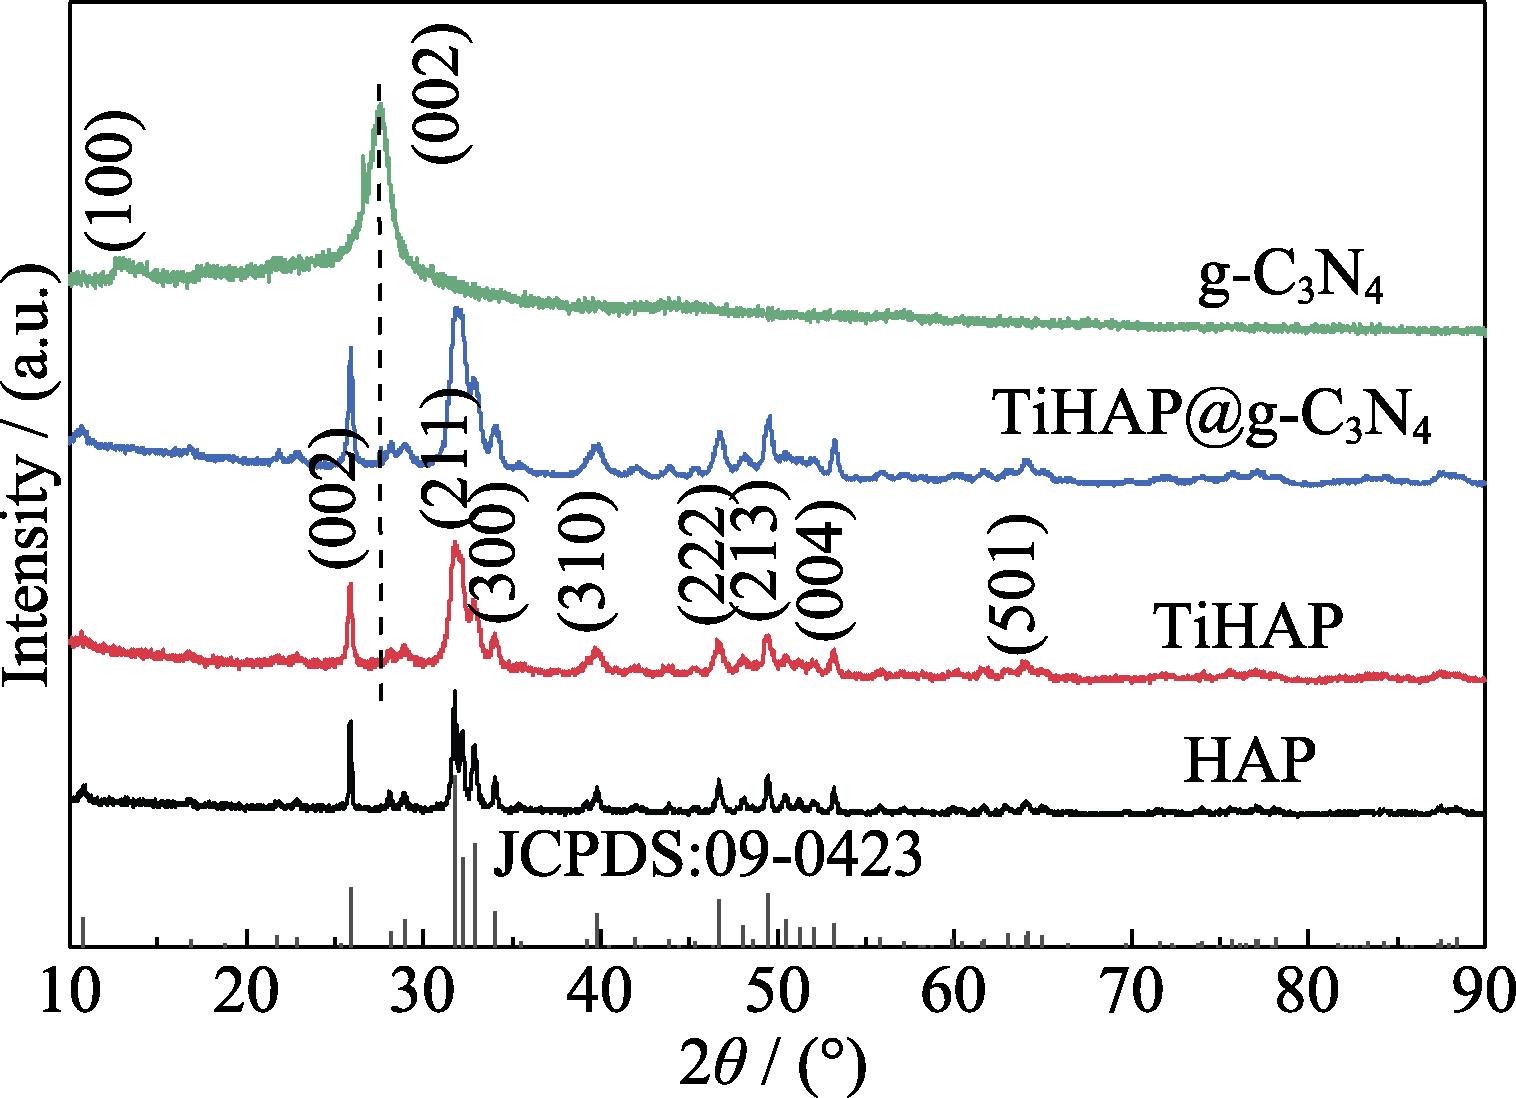
1. XRD patterns of HAP, TiHAP, g-C3N4, and TiHAP@g-C3N4
S1. FT-IR spectra of TiHAP, g-C3N4 and TiHAP@g-C3N4
2. FESEM images of (a) TiHAP, (b) g-C3N4 and (c, d) TiHAP@g-C3N4
3. (a) N2 adsorption-desorption curves and (b) pore size distributions of TiHAP, g-C3N4 and TiHAP@g-C3N4
4. UV-Vis diffuse reflectance spectra of TiHAP, g-C3N4 and TiHAP@g-C3N4
5. (a) Transient photocurrent response curves and (b) Nyquist plots of TiHAP, g-C3N4 and TiHAP@g-C3N4
6. PL spectra of TiHAP, g-C3N4 and TiHAP@g-C3N4
S2. Band gap estimation of (a) TiHAP and (b) g-C3N4
S3. Mott-Schottky plots of (a) TiHAP and (b) g-C3N4
7. Effect of (a) TiHAP@g-C3N4 dosage and (b) initial pH on MO degradation
8. Cyclic experimental results of MO degradation by TiHAP@g-C3N4
9. Effects of different radical trapping agents on MO degradation
10. Schematic mechanism of MO degradation process by TiHAP@g-C3N4 under UV light irradiation
S4. Change of methyl orange concentration and TOC in solution with TiHAP@g-C3N4 dosage of 0.5 g/L and pH 5
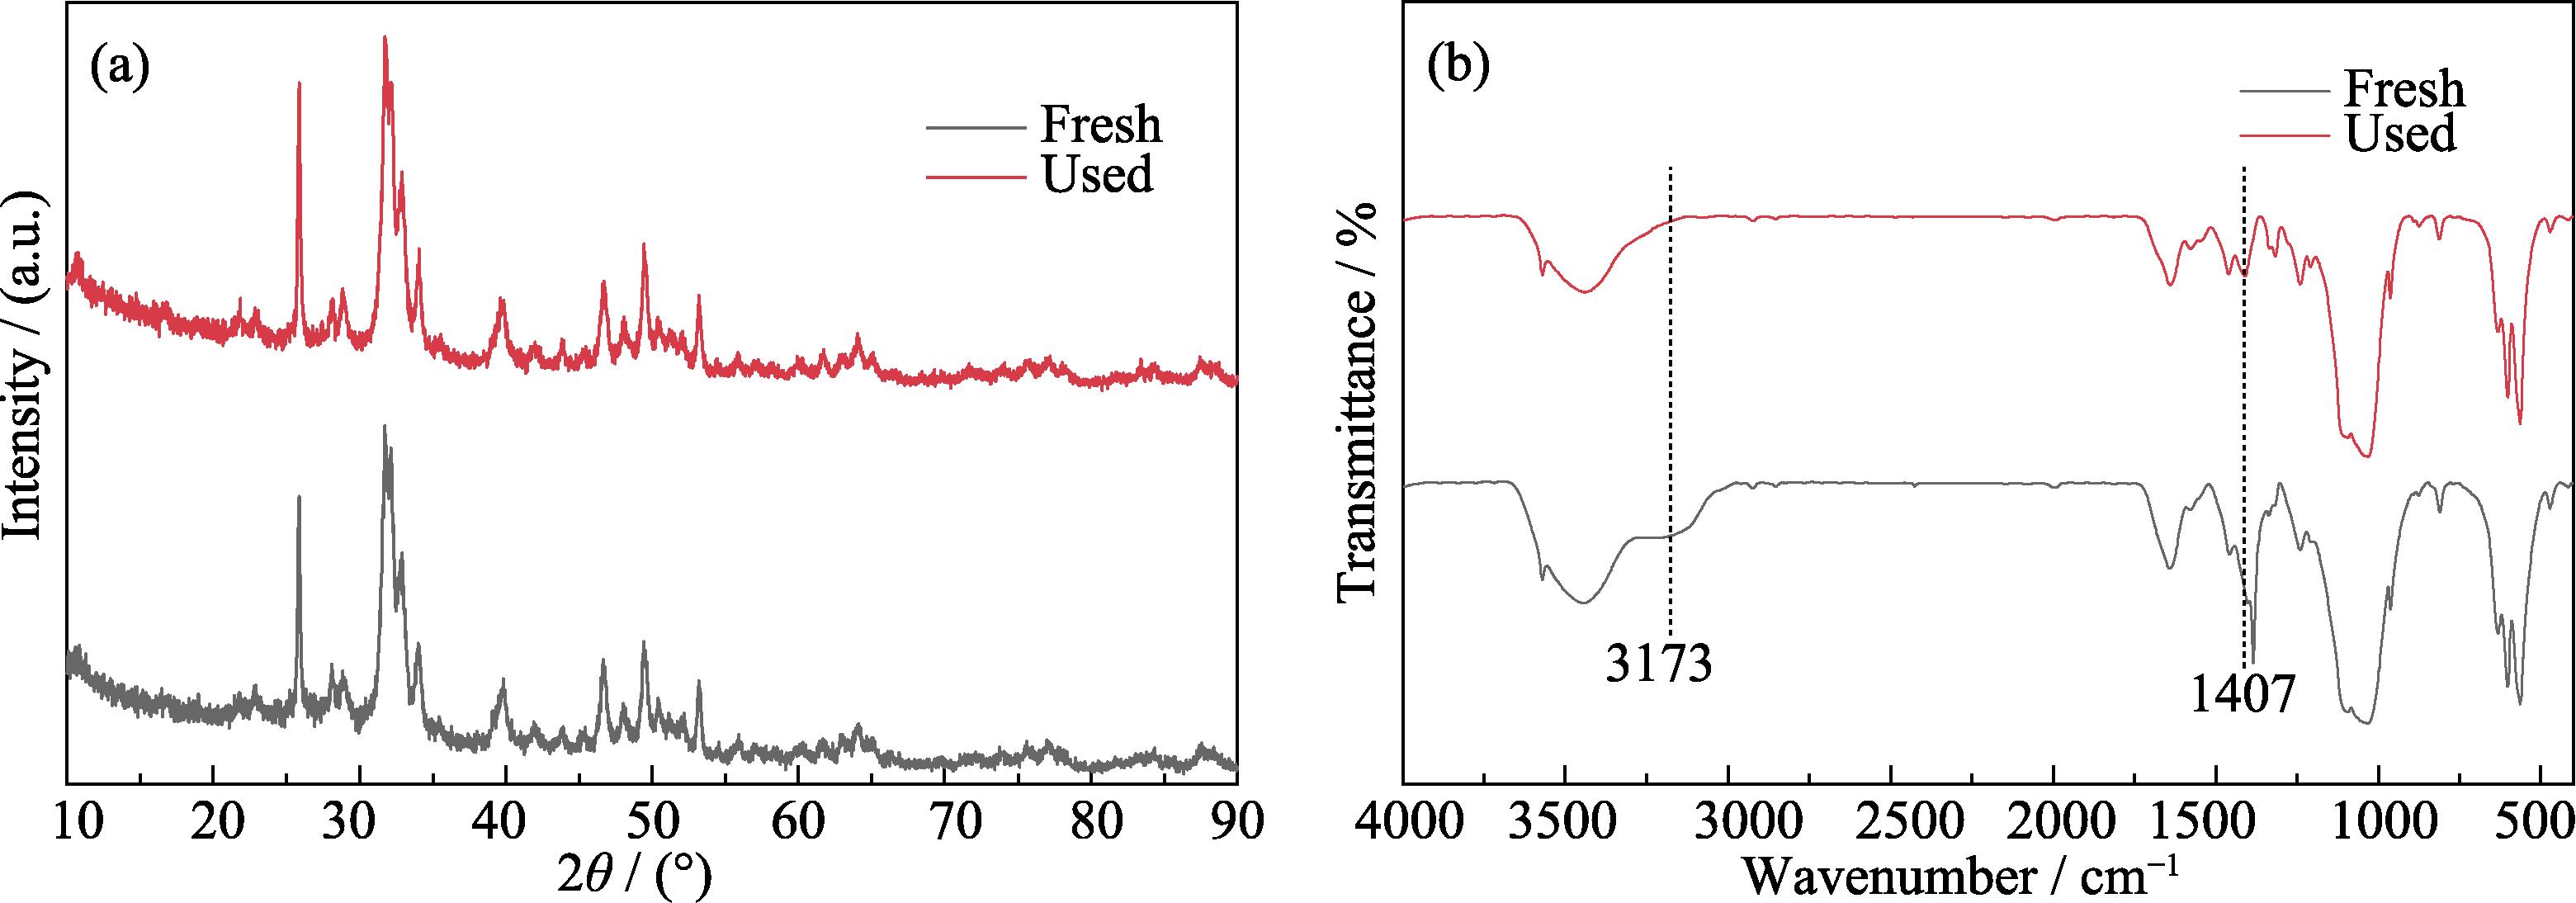
S5. (a) XRD patterns and (b) FT-IR spectra of TiHAP@g-C3N4 before (fresh) and after (used) photocatalytic reactions
|
Table 1. BET specific surface area and pore structure of TiHAP, g-C3N4 and TiHAP@g-C3N4
|
Table 2. Band position of TiHAP and g-C3N4


Set citation alerts for the article
Please enter your email address

© Copyright 2018-2021 | Chinese Laser Press. All Rights Reserved 沪ICP备15018463号-20