• Chinese Optics Letters
  • Vol. 16, Issue 8, 080101 (2018)
Sung-Man Kim*, Jongmyeong Choi, and Hyunwoo Jung
Author Affiliations
  • Department of Electronic Engineering, Kyungsung University, Nam-Gu, Busan 48434, Korea
  • show less
    DOI: 10.3788/COL201816.080101 Cite this Article Set citation alerts
    Sung-Man Kim, Jongmyeong Choi, Hyunwoo Jung. Experimental demonstration of underwater optical wireless power transfer using a laser diode[J]. Chinese Optics Letters, 2018, 16(8): 080101 Copy Citation Text show less
    Expected transfer efficiencies of wireless power charge technologies as a function of transfer distance.
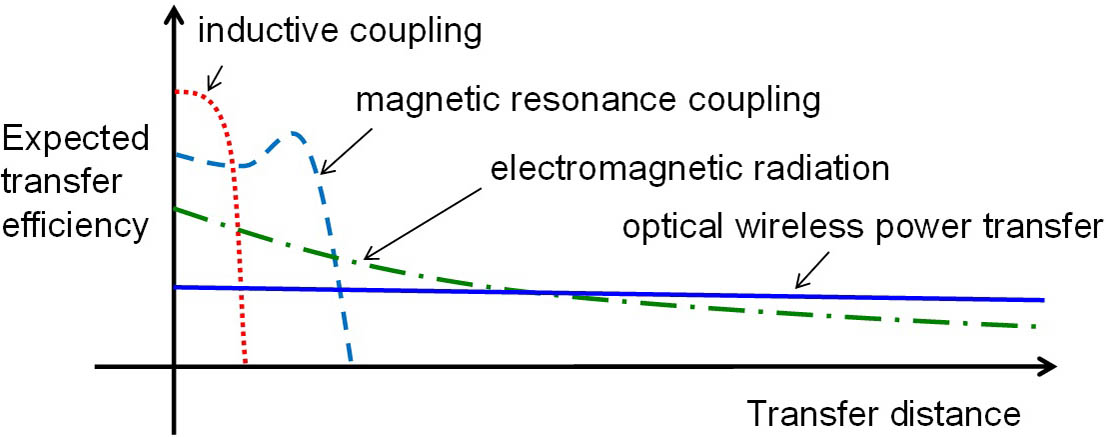
    Fig. 1. Expected transfer efficiencies of wireless power charge technologies as a function of transfer distance.
    Structure of OWPT.
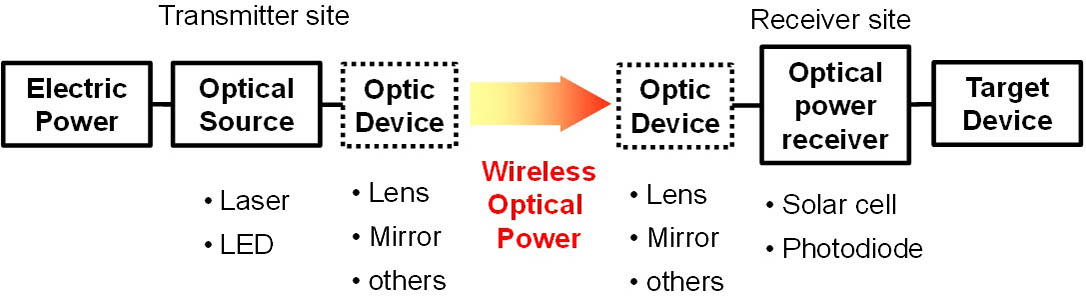
    Fig. 2. Structure of OWPT.
    (a) Block diagram and (b) photograph of the experimental setup for underwater OWPT. The transmitter is located at the left side in the block diagram, whereas it is at the right side in the photograph.
    Fig. 3. (a) Block diagram and (b) photograph of the experimental setup for underwater OWPT. The transmitter is located at the left side in the block diagram, whereas it is at the right side in the photograph.
    Optical output power and E/O conversion efficiency of the LD.
    Fig. 4. Optical output power and E/O conversion efficiency of the LD.
    Voltage–current graph of the PD by changing the load resistance when the LD is operating at the most efficient condition.
    Fig. 5. Voltage–current graph of the PD by changing the load resistance when the LD is operating at the most efficient condition.
    Voltage–current graph of the solar cell by changing the load resistance when the LD is operating at the most efficient condition.
    Fig. 6. Voltage–current graph of the solar cell by changing the load resistance when the LD is operating at the most efficient condition.
    E/O conversion efficiency of the LD, O/E conversion efficiency of the PD, and the total back-to-back transfer efficiency as a function of LD optical power.
    Fig. 7. E/O conversion efficiency of the LD, O/E conversion efficiency of the PD, and the total back-to-back transfer efficiency as a function of LD optical power.
    E/O conversion efficiency of the LD, O/E conversion efficiency of the solar cell, and the total back-to-back transfer efficiency as a function of LD optical power.
    Fig. 8. E/O conversion efficiency of the LD, O/E conversion efficiency of the solar cell, and the total back-to-back transfer efficiency as a function of LD optical power.
    Transfer efficiencies of the underwater OWPT as a function of transfer distance. The dashed line is the analytic graph of the sea water with the attenuation parameter of 0.69 m−1.
    Fig. 9. Transfer efficiencies of the underwater OWPT as a function of transfer distance. The dashed line is the analytic graph of the sea water with the attenuation parameter of 0.69m1.
    Expected transfer efficiency of the seawater OWPT as a function of transfer distance by using the measured attenuation parameter.
    Fig. 10. Expected transfer efficiency of the seawater OWPT as a function of transfer distance by using the measured attenuation parameter.
    Type of Receiver
    ParameterPDSolar Cell
    LD output power50 mW130 mW
    E/O efficiency of the LD (CE/O)41.0%45.5%
    O/E efficiency of the receiver (CO/E)10.4%8.7%
    Optimum load resistance of the receiver39Ω390Ω
    Total transfer efficiency (EBtoB)4.3%4.0%
    Table 1. Parameter Values at the Maximum Transfer Efficiencies with the PD and the Solar Cell Receivers
    Sung-Man Kim, Jongmyeong Choi, Hyunwoo Jung. Experimental demonstration of underwater optical wireless power transfer using a laser diode[J]. Chinese Optics Letters, 2018, 16(8): 080101
    Download Citation