• Journal of Infrared and Millimeter Waves
  • Vol. 40, Issue 2, 272 (2021)
Kai LI1、2、3, Wen-Li LI1、2、3, and Chang-Pei HAN1、2、*
Author Affiliations
  • 1Shanghai Institute of Technical Physics,Chinese Academy of Sciences,Shanghai 200083,China
  • 2Key Laboratory of Infrared Detection and Imaging Technology,Chinese Academy of Sciences,Shanghai 200083,China
  • 3University of Chinese Academy of Sciences,Beijing 100049,China
  • show less
    DOI: 10.11972/j.issn.1001-9014.2021.02.018 Cite this Article
    Kai LI, Wen-Li LI, Chang-Pei HAN. The method based on L1 norm optimization model for stripe noise removal of remote sensing image[J]. Journal of Infrared and Millimeter Waves, 2021, 40(2): 272 Copy Citation Text show less
    The framework of the proposed model
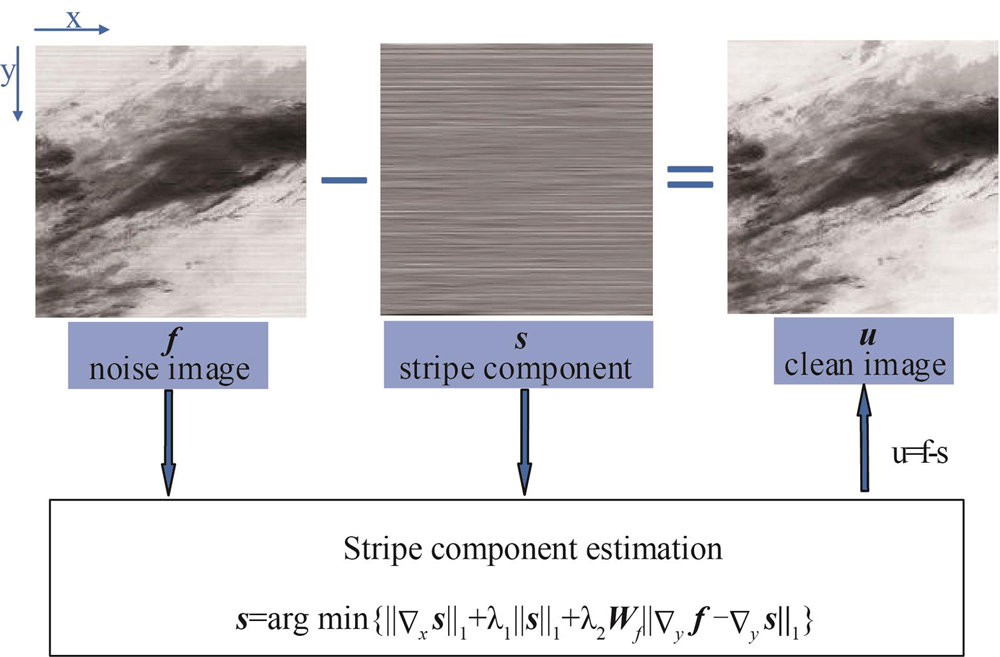
    Fig. 1. The framework of the proposed model
    (a) The original remote sensing image, (b) weighting factor image in Eq. 8, (c) the smooth part, (d) the high frequency part, (e) weighting factor image in Eq. 9, (f) edge weighting image in Eq. 10
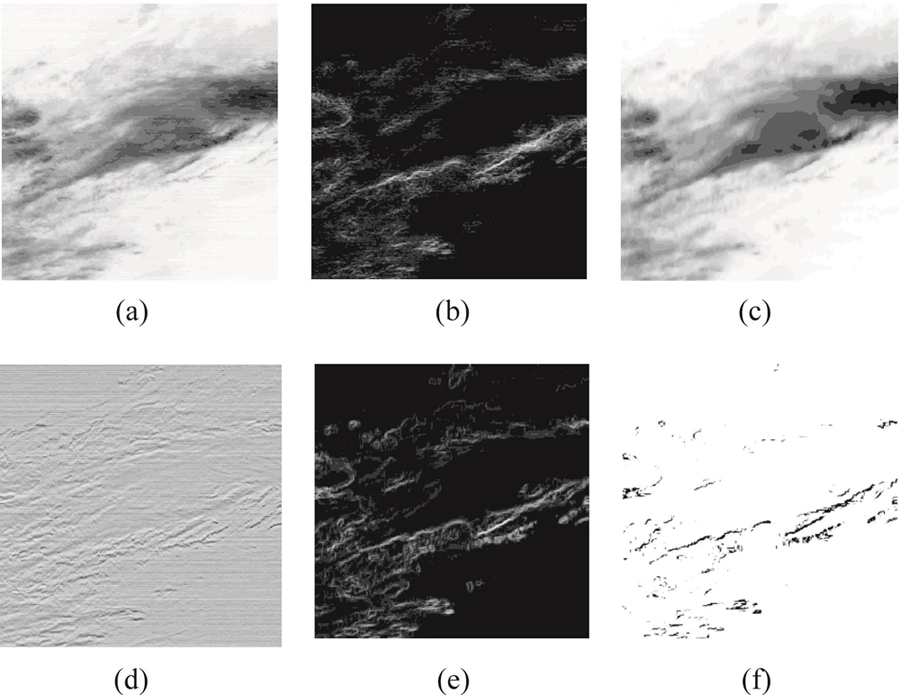
    Fig. 2. (a) The original remote sensing image, (b) weighting factor image in Eq. 8, (c) the smooth part, (d) the high frequency part, (e) weighting factor image in Eq. 9, (f) edge weighting image in Eq. 10
    Destriped results of AGRI band 11 subimage (a) original image, (b) WFAF, (c) SLD, (d) UTV, (e) proposed method
    Fig. 3. Destriped results of AGRI band 11 subimage (a) original image, (b) WFAF, (c) SLD, (d) UTV, (e) proposed method
    Mean line profiles for images shown in Fig. 3, (a) WFAF, (b) SLD, (c) UTV, (d) proposed method
    Fig. 4. Mean line profiles for images shown in Fig. 3, (a) WFAF, (b) SLD, (c) UTV, (d) proposed method
    Column-averaged power spectrum for images shown in Fig. 3 (a) original image, (b) WFAF, (c) SLD, (d) UTV, (e) proposed method
    Fig. 5. Column-averaged power spectrum for images shown in Fig. 3 (a) original image, (b) WFAF, (c) SLD, (d) UTV, (e) proposed method
    Destriped results of AGRI band 11 subimage, (a) original image, (b) WFAF, (c) SLD, (d) UTV, (e) proposed method
    Fig. 6. Destriped results of AGRI band 11 subimage, (a) original image, (b) WFAF, (c) SLD, (d) UTV, (e) proposed method
    The extracted stripe components of different algorithms (a) WFAF, (b) SLD, (c) UTV, (d) proposed method
    Fig. 7. The extracted stripe components of different algorithms (a) WFAF, (b) SLD, (c) UTV, (d) proposed method
    Mean line profiles for images shown in Fig. 6 (a) WFAF, (b) SLD, (c) UTV, (d) proposed method
    Fig. 8. Mean line profiles for images shown in Fig. 6 (a) WFAF, (b) SLD, (c) UTV, (d) proposed method
    Column-averaged power spectrum for images shown in Fig. 6, (a) original image, (b) WFAF, (c) SLD, (d) UTV, (e) proposed method
    Fig. 9. Column-averaged power spectrum for images shown in Fig. 6, (a) original image, (b) WFAF, (c) SLD, (d) UTV, (e) proposed method
    (a) Reference image, (b) simulated stripe image
    Fig. 10. (a) Reference image, (b) simulated stripe image
    (a) The PSNR curve with λ1 as independent variable, (b) The PSNR curve with λ2 as independent variable
    Fig. 11. (a) The PSNR curve with λ1 as independent variable, (b) The PSNR curve with λ2 as independent variable
    Processing results of different parameters λ1
    Fig. 12. Processing results of different parameters λ1
    Processing results of different parameters λ2
    Fig. 13. Processing results of different parameters λ2
    Destriping result of AGRI band 9 images with the proposed algorithm
    Fig. 14. Destriping result of AGRI band 9 images with the proposed algorithm
    Destriping result of AGRI band 10 images with the proposed algorithm
    Fig. 15. Destriping result of AGRI band 10 images with the proposed algorithm
    Destriping result of AGRI band 14 images with the proposed algorithm
    Fig. 16. Destriping result of AGRI band 14 images with the proposed algorithm
    1:Input:Stripe image f,parameters λ1λ2 β1β2β3δ and S.
    2:Initialize:Set s0=0Z0=V0=0H0=yfp1=0p2=0p3=0,and ε=10-4.
    3:Solve Wf by(10)
    4:Whilef-sk-f-sk-1/f-sk>ε  and k<Nmaxdo
    5:Solve Zk+1Vk+1Hk+1 using a thresholding method by(14),(17),(19)
    6:Solve sk+1 using FFT by(21)
    7:Update p1k+1p2k+1,and p3k+1 by(22)
    8: End while
    9:Outputuk+1=f-sk+1.
    Table 1. The proposed destriping algorithm
    No.Central Band /μmSpectral Band /μmSpatial ResolutionNumber of pixelsMain Application
    96.255.80∼6.704 km4*1upper-level water vapor
    107.106.90∼7.304 km4*1mid-level water vapor
    118.508.00∼9.004 km4*1integrated water vapor,cloud
    1413.5013.20∼13.804 km4*1cloud,water vapor
    Table 2. Spectral parameters
    ImageIndexWFAFSLDUTVProposed

    AGRI band 11

    Periodical stripes noise

    NR10.0610.7812.9313.67
    MRD(%)1.781 70.734 24.033 40.875 1
    ID0.987 80.999 90.857 00.998 4

    AGRI band 14

    Random stripe noise

    NR7.830 26.400 55.316 58.365 9
    MRD(%)3.086 23.303 64.778 23.065 3
    ID0.945 50.999 90.985 10.998 8
    Table 3. Qualitative results using NR, MRD and ID
    Kai LI, Wen-Li LI, Chang-Pei HAN. The method based on L1 norm optimization model for stripe noise removal of remote sensing image[J]. Journal of Infrared and Millimeter Waves, 2021, 40(2): 272
    Download Citation