• Laser & Optoelectronics Progress
  • Vol. 56, Issue 15, 150602 (2019)
Qiannan Xu1、2, Ciming Zhou1、*, Dian Fan1, Yandong Pang1、2, Chenguang Zhao1、3, Xi Chen1、2, Junbin Huang4, and Hongcan Gu4
Author Affiliations
  • 1 National Engineering Laboratory for Fiber Optic Sensing Technology, Wuhan University of Technology, Wuhan, Hubei 430070, China
  • 2 School of Information Engineering, Wuhan University of Technology, Wuhan, Hubei 430070, China
  • 3 School of Mechanical and Electronic Engineering, Wuhan University of Technology, Wuhan, Hubei 430070, China
  • 4 Department of Weapon Engineering, Naval University of Engineering, Wuhan, Hubei 430033, China
  • show less
    DOI: 10.3788/LOP56.150602 Cite this Article Set citation alerts
    Qiannan Xu, Ciming Zhou, Dian Fan, Yandong Pang, Chenguang Zhao, Xi Chen, Junbin Huang, Hongcan Gu. Experimental Study on Ultra-Weak Fiber Bragg Grating Hydrophone Arrays Based on Fizeau Interference[J]. Laser & Optoelectronics Progress, 2019, 56(15): 150602 Copy Citation Text show less
    Principle diagram of uwFBG hydrophone array system based on Fizeau interference
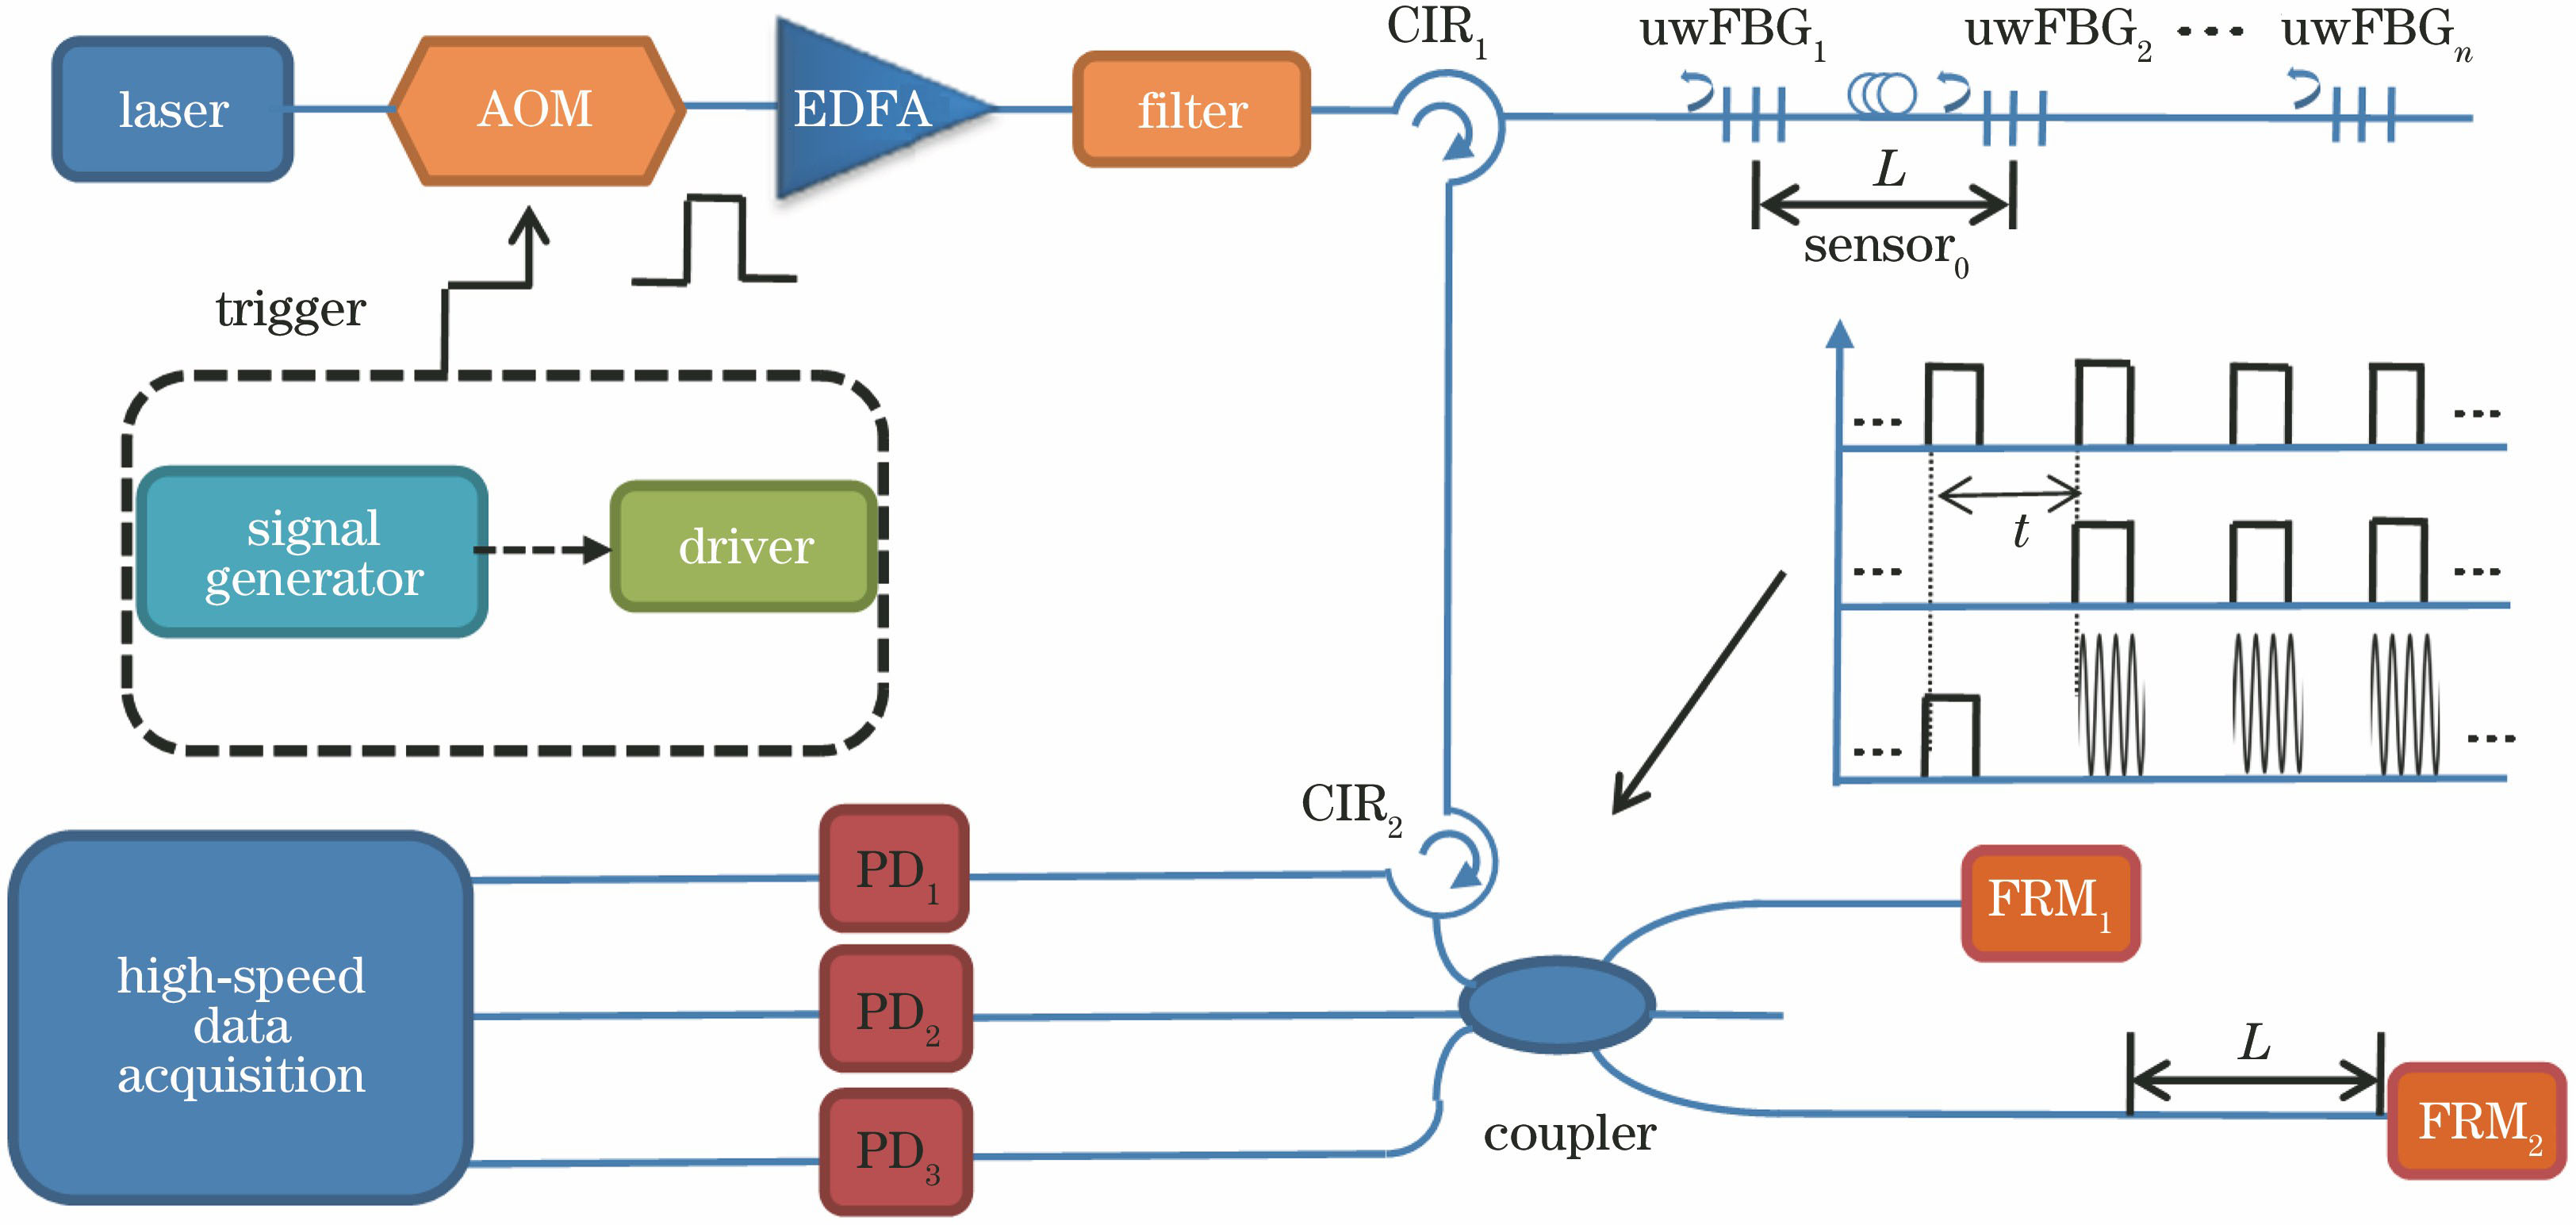
    Fig. 1. Principle diagram of uwFBG hydrophone array system based on Fizeau interference
    Schematic of arc-tangent demodulation algorithm
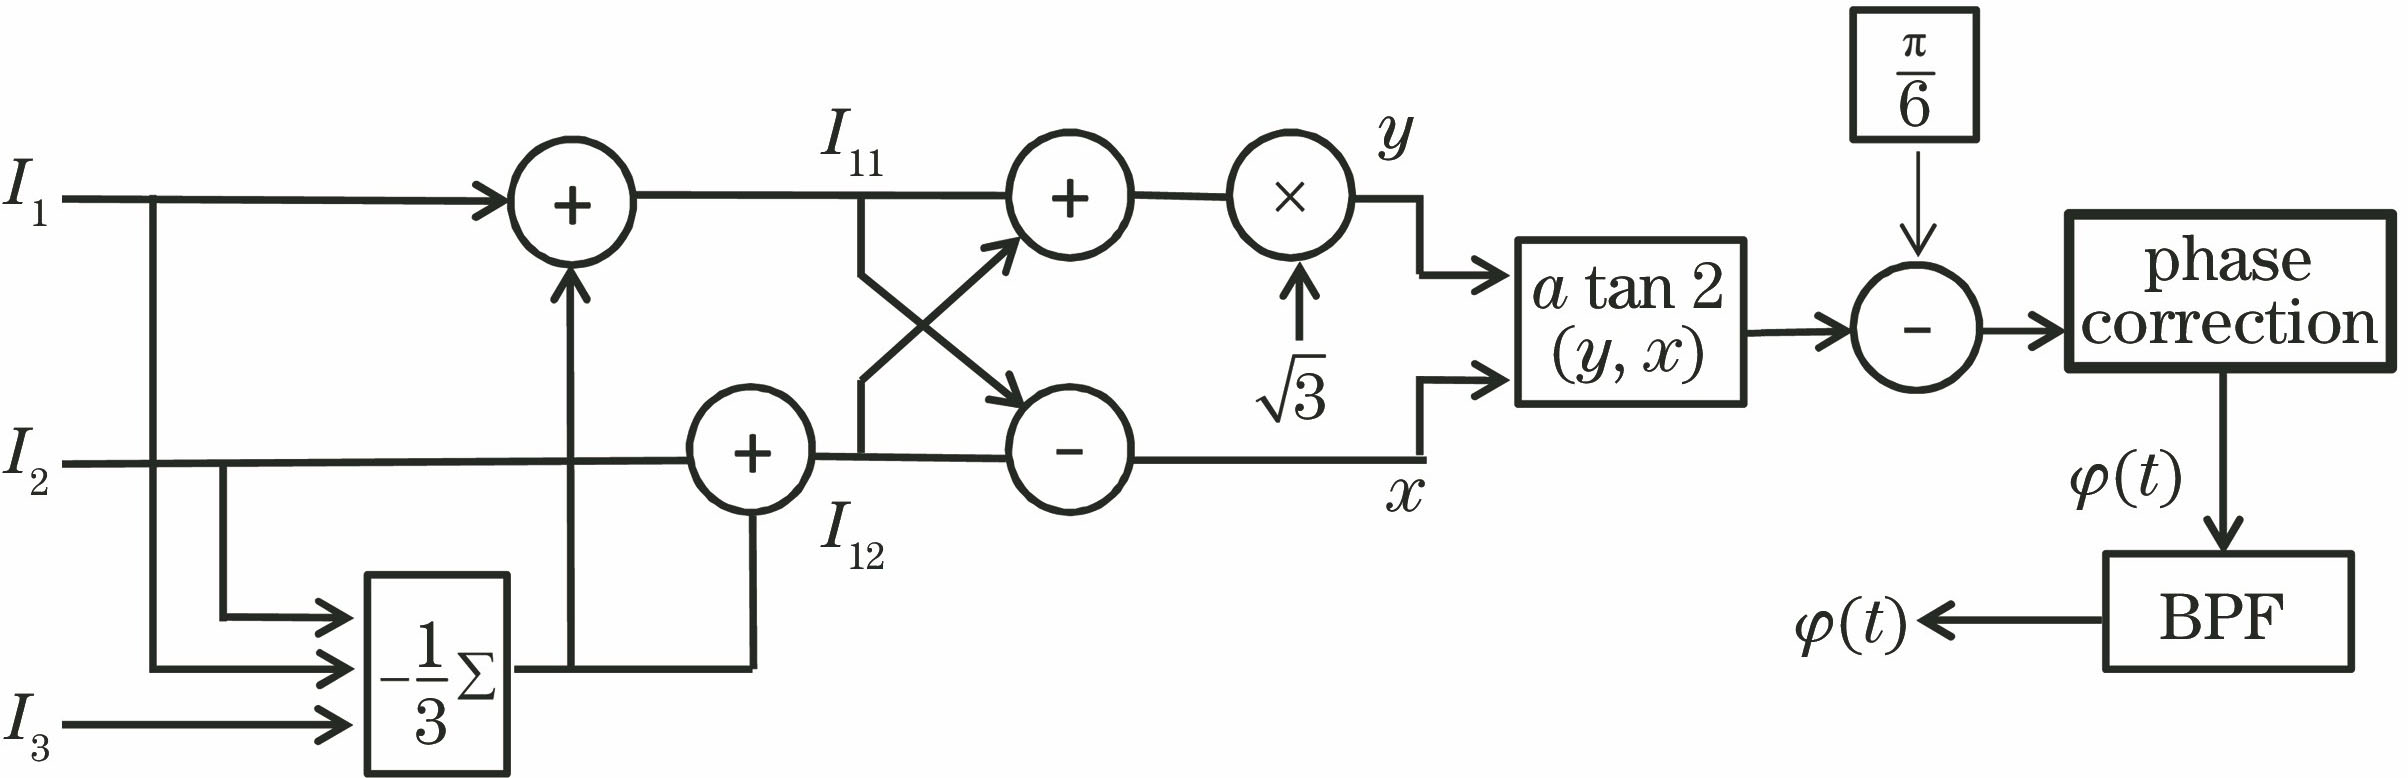
    Fig. 2. Schematic of arc-tangent demodulation algorithm
    Error curves of phase signal to be demodulated and demodulated phase signal
    Fig. 3. Error curves of phase signal to be demodulated and demodulated phase signal
    Experimental setup of vibration liquid column method
    Fig. 4. Experimental setup of vibration liquid column method
    Time domain diagrams of underwater acoustic signal demodulated by uwFBG hydrophone with sensor's cavity length of 200 m when frequency of signal generator is 2, 10, 100, 500, 1000, 2000 Hz
    Fig. 5. Time domain diagrams of underwater acoustic signal demodulated by uwFBG hydrophone with sensor's cavity length of 200 m when frequency of signal generator is 2, 10, 100, 500, 1000, 2000 Hz
    Frequency domain diagram of underwater acoustic signal demodulated by the uwFBG hydrophone with sensor's cavity length of 200 m when frequency of signal generator is 2, 10, 100, 500, 1000, 2000 Hz
    Fig. 6. Frequency domain diagram of underwater acoustic signal demodulated by the uwFBG hydrophone with sensor's cavity length of 200 m when frequency of signal generator is 2, 10, 100, 500, 1000, 2000 Hz
    Variation of phase acoustic-pressure sensitivity of uwFBG hydrophone at different sensor cavity lengths with increasing frequency
    Fig. 7. Variation of phase acoustic-pressure sensitivity of uwFBG hydrophone at different sensor cavity lengths with increasing frequency
    Variation of phase acoustic-pressure sensitivity of uwFBG hydrophone at different sensor cavity lengths when vibration signal frequency is 10 Hz with amplitude of 10-500 mV
    Fig. 8. Variation of phase acoustic-pressure sensitivity of uwFBG hydrophone at different sensor cavity lengths when vibration signal frequency is 10 Hz with amplitude of 10-500 mV
    Time domain diagram of underwater acoustic signal demodulated by four uwFBG hydrophones when vibration signal frequency is 10 Hz with amplitude of 400 mV
    Fig. 9. Time domain diagram of underwater acoustic signal demodulated by four uwFBG hydrophones when vibration signal frequency is 10 Hz with amplitude of 400 mV
    Frequency domain diagram of underwater acoustic signal demodulated by four uwFBG hydrophones when vibration signal frequency is 10 Hz with amplitude of 400 mV
    Fig. 10. Frequency domain diagram of underwater acoustic signal demodulated by four uwFBG hydrophones when vibration signal frequency is 10 Hz with amplitude of 400 mV
    Qiannan Xu, Ciming Zhou, Dian Fan, Yandong Pang, Chenguang Zhao, Xi Chen, Junbin Huang, Hongcan Gu. Experimental Study on Ultra-Weak Fiber Bragg Grating Hydrophone Arrays Based on Fizeau Interference[J]. Laser & Optoelectronics Progress, 2019, 56(15): 150602
    Download Citation