
Jeff Demas, Lars Rishøj, Xiao Liu, Gautam Prabhakar, Siddharth Ramachandran. Intermodal group-velocity engineering for broadband nonlinear optics[J]. Photonics Research, 2019, 7(1): 1
- Photonics Research
- Vol. 7, Issue 1, 1 (2019)
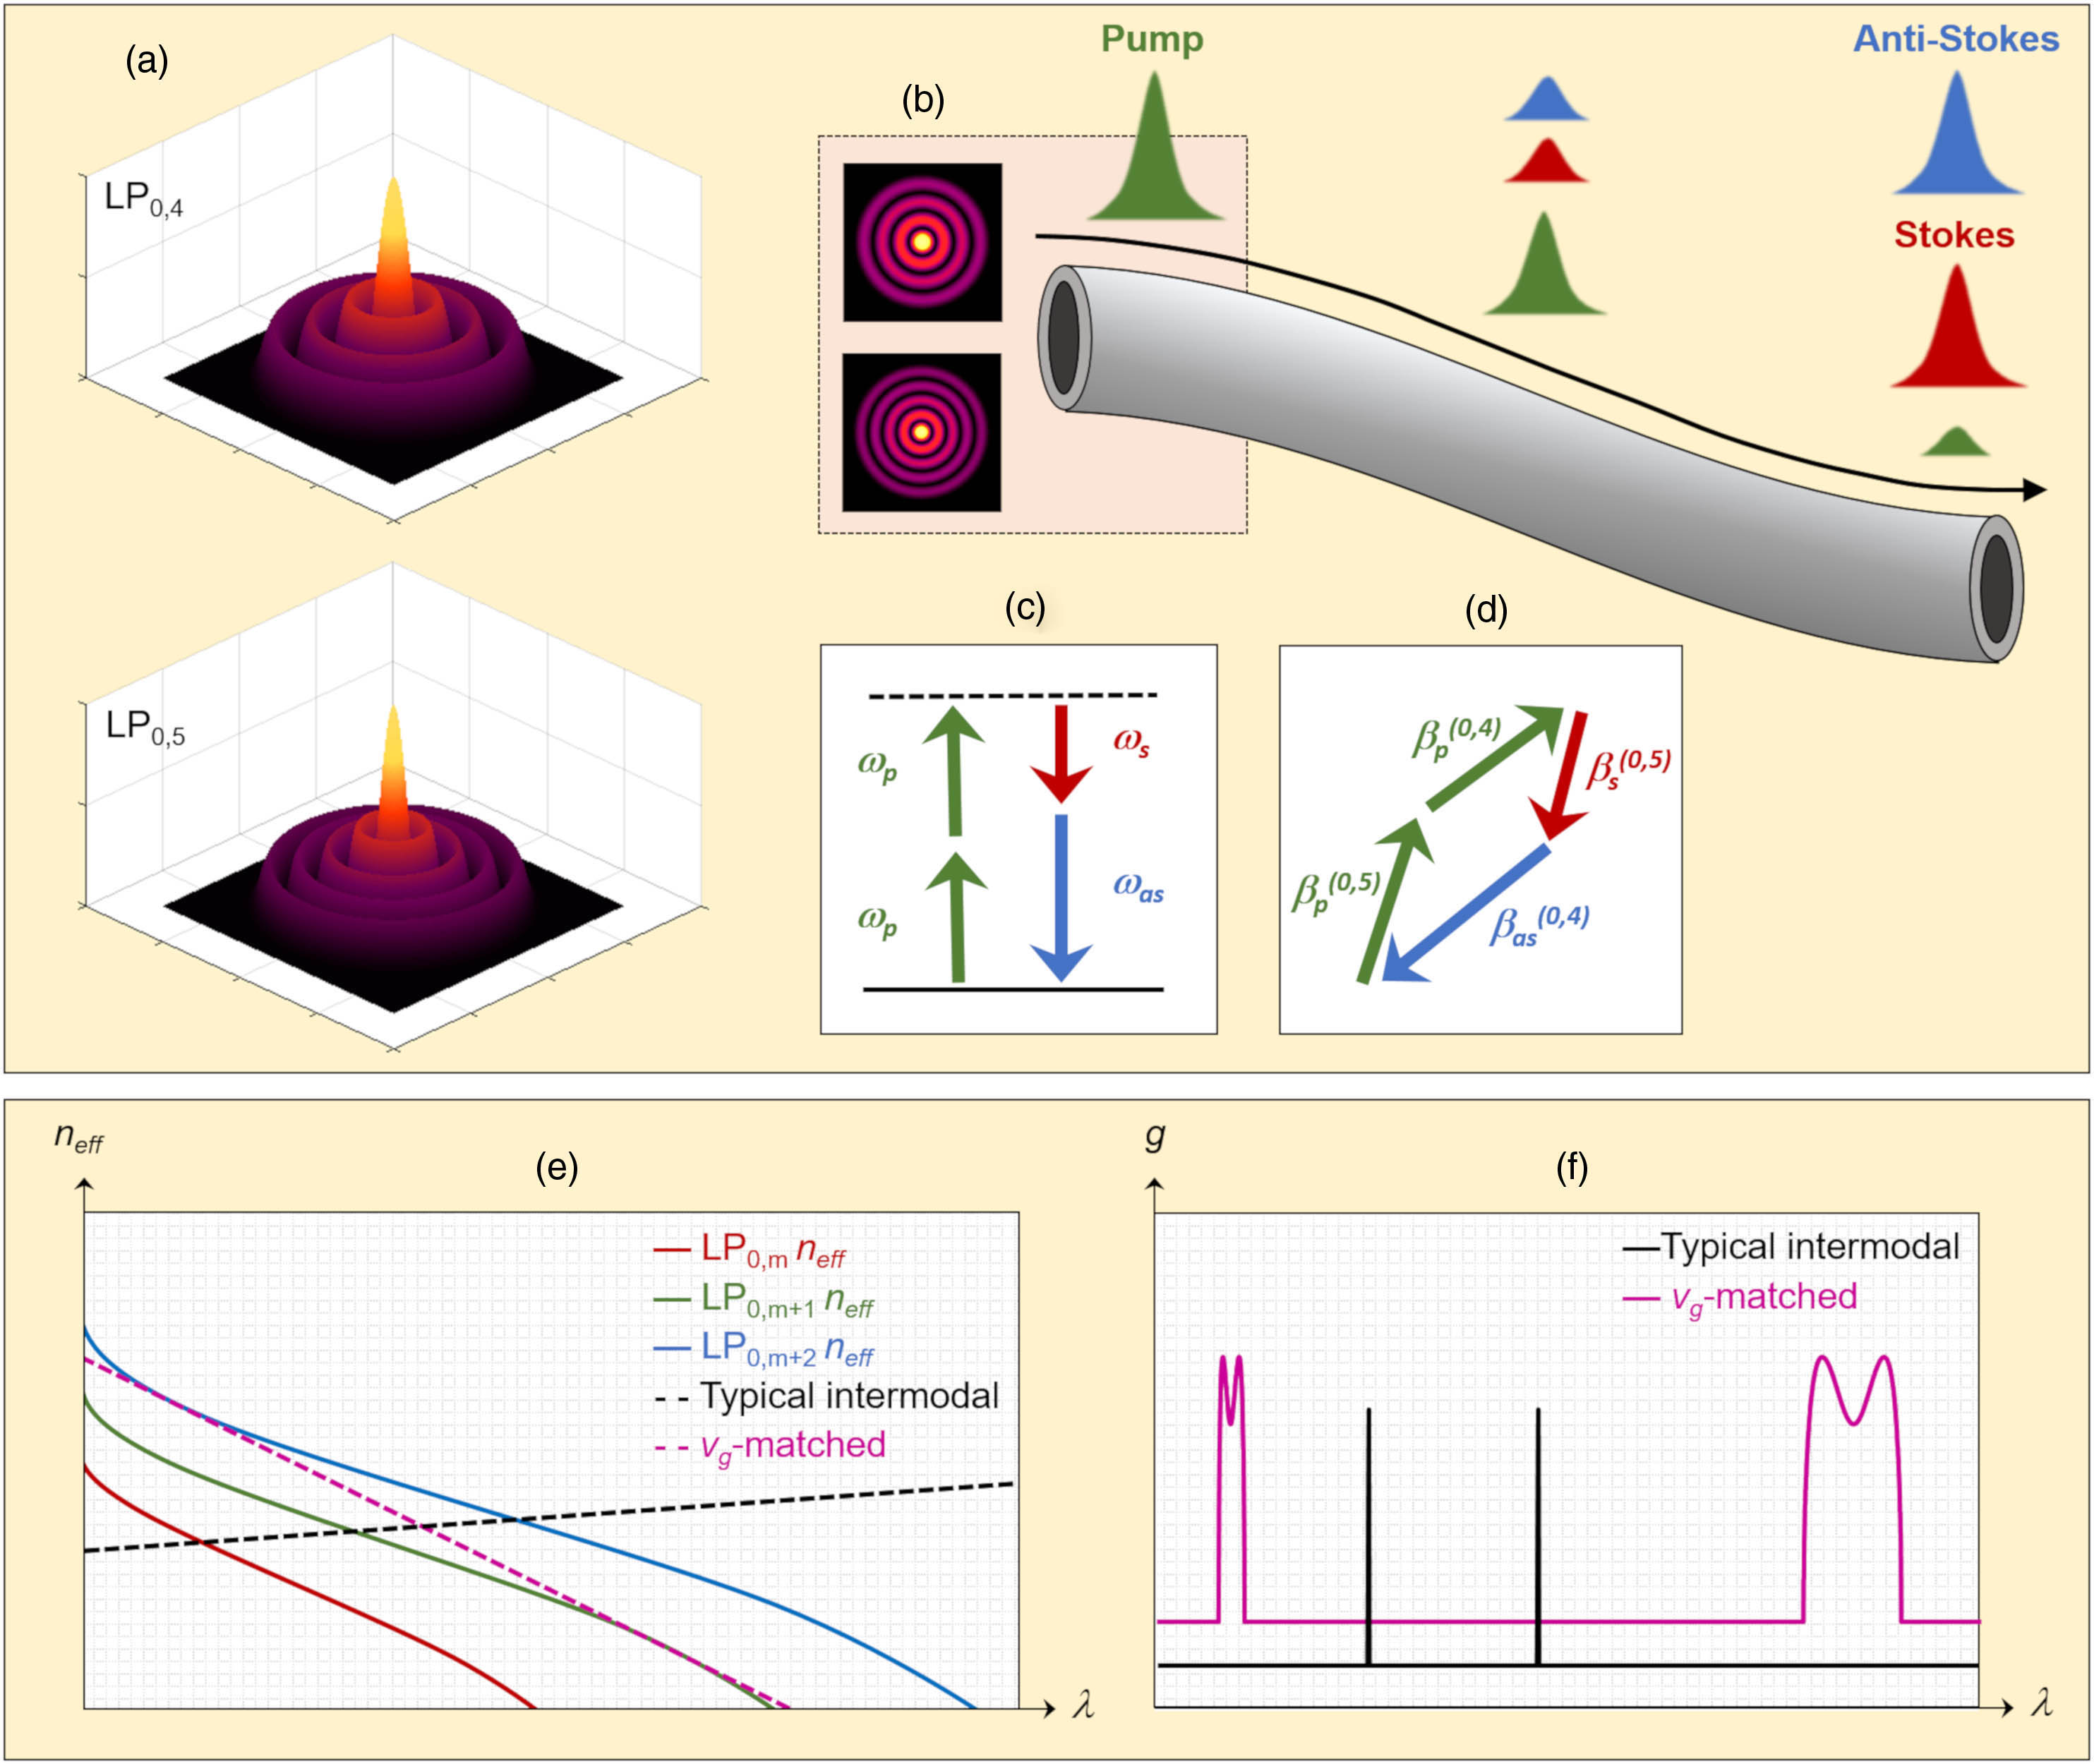
Fig. 1. (a) Intensity profiles of the pump modes LP 0 , 4 LP 0 , 5 n eff m n eff
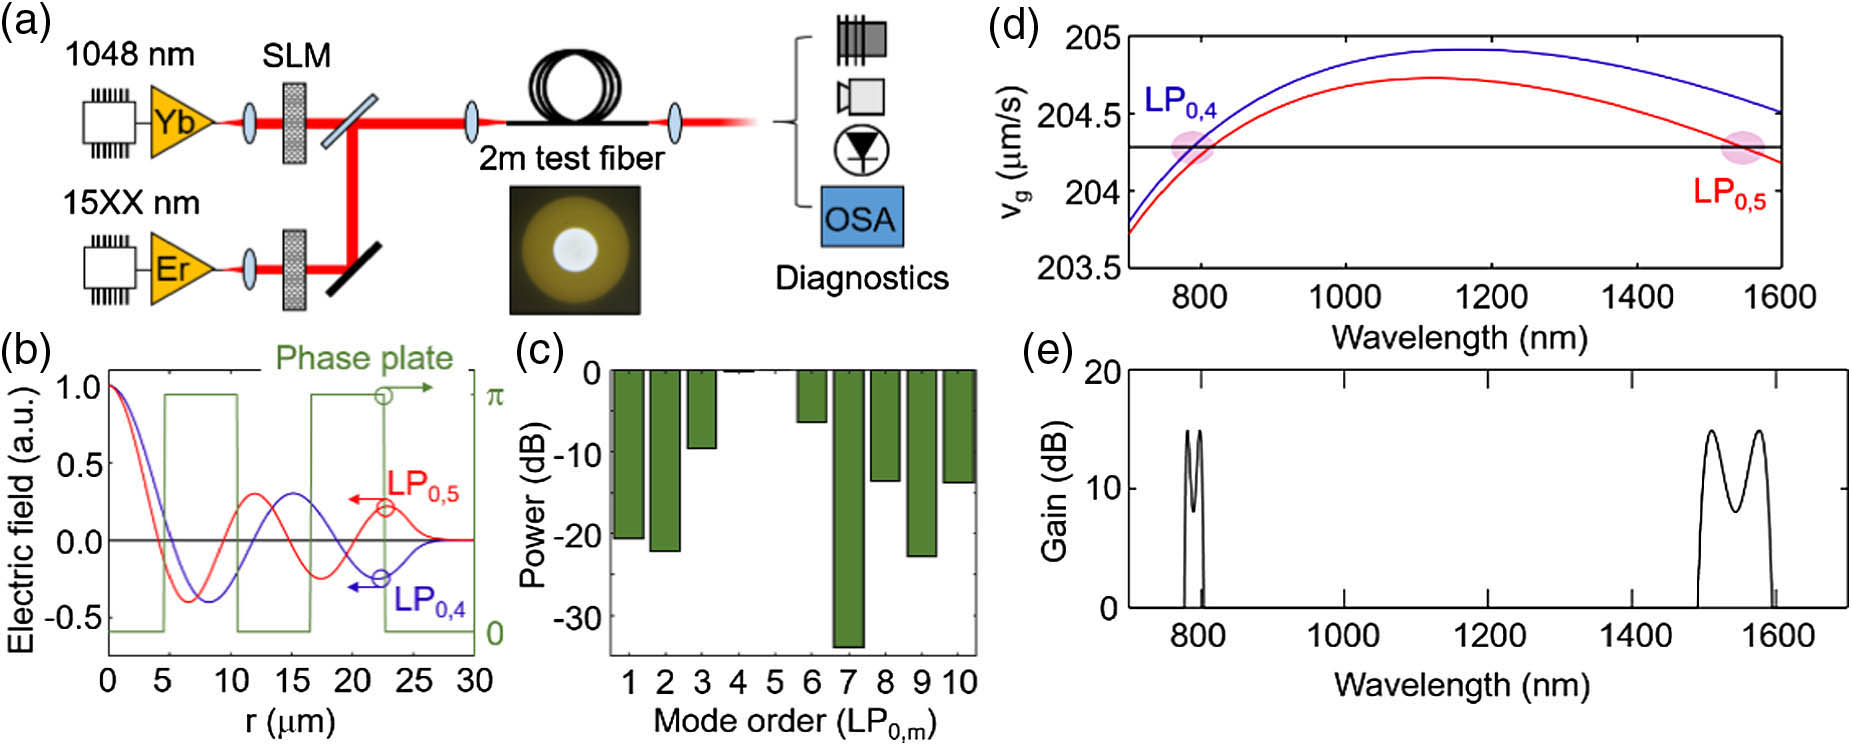
Fig. 2. (a) Setup schematic for intermodal four-wave mixing experiments. SLM, spatial light modulator; OSA, optical spectrum analyzer. (b) Simulated electric field profiles of the LP 0 , 4 LP 0 , 5 LP 0 , 5 ∼ 12 % LP 0 , 4 LP 0 , 5 LP 0 , 4 LP 0 , 5
Fig. 3. (a) Spontaneous four-wave mixing spectra as a function of pump wavelength; each spectrum offset by 50 dB for clarity. (b) Zoom-in of the bandwidth-optimized spontaneous spectrum (λ p = 1047.6 nm
Fig. 4. Full experimental spectra as a function of seed wavelength (1535–1570 nm) showing conversion to the Ti:sapphire band (786–795 nm) with representative experimental mode images shown as inset; each spectrum offset by 70 dB for clarity.
Fig. 5. Experimentally measured pump profiles for the (a) pump (pump alone shown as a solid black line; pump combined with seed shown as a dotted purple line), (b) anti-Stokes, and (c) Stokes wavelengths for a 1545 nm wavelength seed. (d) Peak pump depletion (purple markers, left axis) and peak Stokes gain (brown markers, right axis) as a function of seed wavelength. (e) Peak power (anti-Stokes shown with blue markers; Stokes shown with red markers).
|
Table 1. Additional Simulated Broadband FWM Processes

Set citation alerts for the article
Please enter your email address
© Copyright 2018-2021 | Chinese Laser Press. All Rights Reserved 沪ICP备15018463号-20