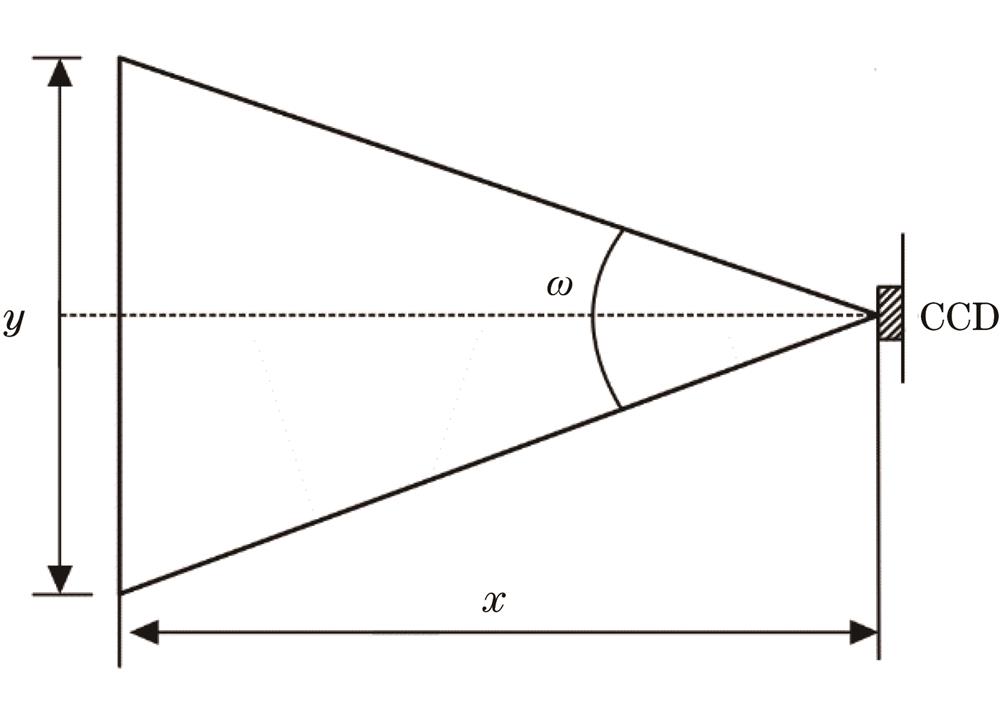
Fig. 1. Schematic of horizontal field angle of lens
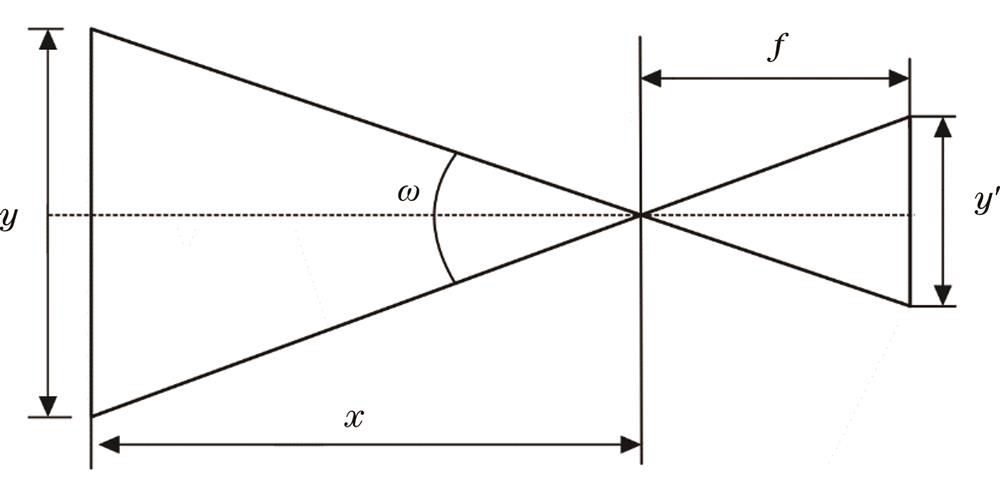
Fig. 2. Schematic of focal length calculation
Fig. 3. Schematic of depth of field
Fig. 4. Initiating structure figure
Fig. 5. Three-dimensional view of Tessar structure
Fig. 6. Field curvature and distortion curves before and after optimization. (a) Before optimization; (b) after optimization
Fig. 7. Comparison of spot diagram before and after optimization. (a) Before optimization; (b) after optimization
Fig. 8. Diagram of MTF curve
Parameter | Value |
---|
Focal length /mm | 6 | Entrance diameter /mm | 1.76454 | Half field of view /(°) | 25 | Spectral range /μm | 0.486‒0.656 | Relative distortion /% | <0.5 | Modulation transfer function | ≥0.5@107 lp/mm | Spotradius encircled 80% energy /μm | <3.2 | Depth of field /m | 10 |
|
Table 1. Design indexes of Tessar vehicle lens
Parameter | Lens 1 | | Lens 2 | | Stop | Lens 3 | | Image |
---|
Sequence | 1 | 2 | 3 | 4 | 5 | 6 | 7 | 8 | Radius | 2.021 | 1.362 | 3.939 | 3.058 | Infinity | -19.940 | -2.338 | Infinity | Thickness | 0.670 | 0.665 | 1.231 | 0.182 | 0.802 | 0.849 | 6.351 | |
|
Table 2. Initiating structure parameter
Parameter | Lens 1 | | Lens 2 | | Stop | Lens 3 | Lens 4 | | Image |
---|
Sequence | 1 | 2 | 3 | 4 | 5 | 6 | 7 | 8 | 9 | Radius | 2.246 | 2.704 | 22.058 | 11.910 | Infinity | -4.611 | -1.147 | -2.310 | Infinity | Thickness | 0.546 | 0.581 | 0.300 | 0.600 | 0.495 | 0.479 | 0.733 | 4.445 | |
|
Table 3. Lens structure parameters after optimization
Type | | | Value | Criterion | Change |
---|
TSDX | 1 | | 0.01000000 | 0.61998101 | -0.04294991 | TSDY | 1 | | 0.01000000 | 0.61998101 | -0.04294991 | TSDX | 1 | | -0.01000000 | 0.61998101 | -0.04294991 | TSDY | 1 | | -0.01000000 | 0.61998101 | -0.04294991 | TTHI | 2 | 4 | 0.03000000 | 0.62469954 | -0.03642230 | TFRN | 3 | | 1.00000000 | 0.62650862 | -0.03642230 | TEDY | 1 | 2 | -0.02000000 | 0.62804440 | -0.03488652 | TEDX | 1 | 2 | -0.02000000 | 0.62804440 | -0.03488652 | TEDX | 1 | 2 | 0.02000000 | 0.62804440 | -0.03488652 | TEDY | 1 | 2 | 0.02000000 | 0.62804440 | -0.03488652 |
|
Table 4. Results of the most sensitive tolerance analysis unit: mm
Surface | 1 | 2 | 3 | 4 | 5 | 6 | 7 | 8 |
---|
Radius tolerance | ±3 | ±3 | ±1 | ±1 | | ±3 | ±3 | ±3 | Thickness tolerance /mm | ±0.03 | ±0.03 | ±0.02 | ±0.03 | ±0.02 | ±0.02 | ±0.02 | | Element eccentricity tolence /mm | ±0.02 | | ±0.02 | | | ±0.02 | | | Surface eccentricity tolence /mm | 0.01 | 0.01 | 0.02 | 0.02 | | 0.01 | 0.005 | 0.005 | Surface irregularity | ±0.2 | ±0.2 | ±0.1 | ±0.2 | | ±0.2 | ±0.2 | ±0.2 | Refractive index | 0.001 | | 0.001 | | | 0.001 | 0.001 | | Abbe coefficient tolerance /% | ±0.9 | | ±2.6 | | | ±0.7 | ±0.4 | |
|
Table 5. Allowable tolerances for parts
Number of Monte Carlo samples /% | MTF value |
---|
>90 | 0.48677996 | >80 | 0.51156053 | >50 | 0.55240768 | >20 | 0.59662360 | >10 | 0.61346962 |
|
Table 6. Results of Monte Carlo tolerance analysis