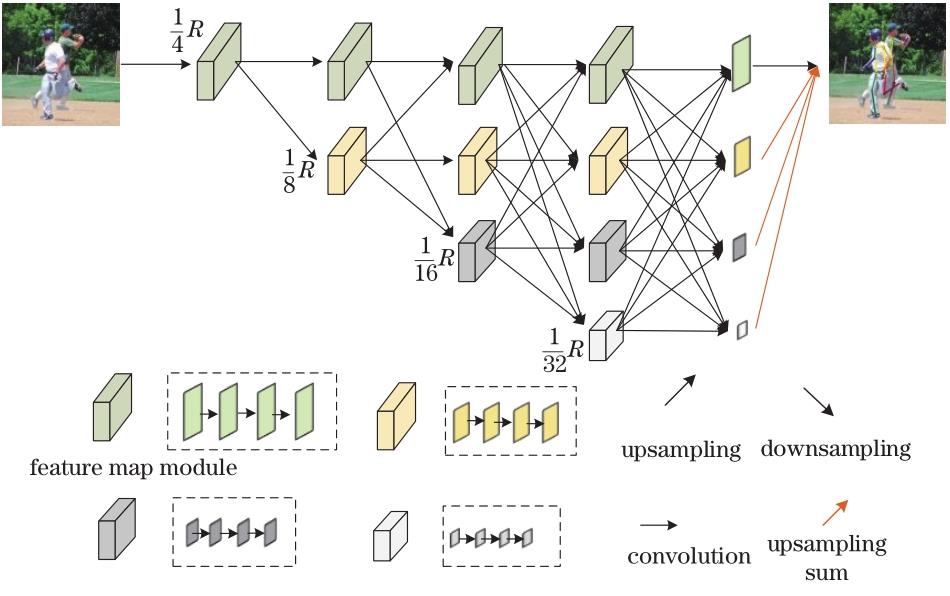
Fig. 1. Network structure
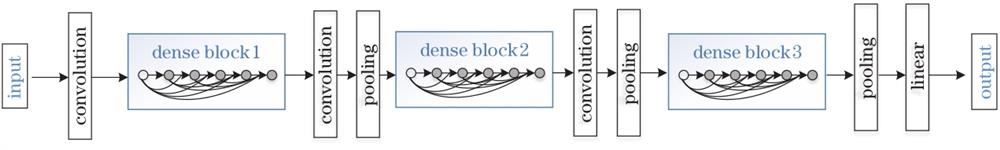
Fig. 2. DenseNet
Fig. 3. Improved dense network module. (a) Residual unit; (b) dense cell
Fig. 4. Comparison of fusion methods. (a) Final fusion method of original HRNet; (b) improved final fusion method
Fig. 5. Model training loss function curve. (a) First stage loss value; (b) second stage loss value
Fig. 6. Comparison of prediction accuracy of various parts of different methods
Fig. 7. Validation results. (a) Key parts overlap detection map;(b) obstacle occlusion detection map;(c) multi-person detection map
Fig. 8. Sample analysis of insufficient model performance
Serial number | Name | Serial number | Name |
---|
0 | Nose | 9 | Right knee | 1 | Neck | 10 | Right ankle | 2 | Right shoulder | 11 | Left hip | 3 | Right elbow | 12 | Left knee | 4 | Right wrist | 13 | Left ankle | 5 | Left shoulder | 14 | Right eye | 6 | Left elbow | 15 | Left eye | 7 | Left wrist | 16 | Right ear | 8 | Right crotch | 17 | Left ear |
|
Table 1. Key points in COCO dataset
Method | #Params /MB | GFLOPs | Model size /MB | AP /% | AP50 /% | AP75 /% | APL /% | APM /% |
---|
CPN | 27.0 | 6.2 | 314.0 | 68.6 | | | | | SimpleBaseline‐50 | 34.0 | 9.0 | 129.0 | 70.4 | 88.6 | 78.3 | 67.1 | 77.2 | SimpleBaseline‐101 | 53.0 | 12.4 | 202.0 | 71.4 | 89.3 | 79.3 | 68.1 | 78.1 | HRNetV1 | 28.5 | 16.0 | 109.4 | 74.9 | 92.5 | 82.8 | 71.3 | 80.9 | HigherHRNet | 28.6 | 47.9 | 109.8 | 66.4 | 87.5 | 72.8 | 61.2 | 74.2 | HRNet | 28.5 | 7.1 | 109.0 | 74.4 | 90.5 | 81.9 | 70.8 | 81.0 | Proposed method | 10.1 | 6.5 | 30.6 | 74.8 | 92.6 | 83.2 | 72.2 | 77.7 |
|
Table 2. Validation and comparison of different methods under COCO dataset
Method | Head | Shoulder | Elbow | Wrist | Crotch | Lap | Ankle | Mean |
---|
DeeperCut[21] | 97.2 | 94.5 | 87.3 | 82.4 | 86.2 | 81.7 | 77.2 | 86.6 | SimpleBaseline‐50 | 96.4 | 95.3 | 89.0 | 83.2 | 88.4 | 84.0 | 79.6 | 88.5 | SimpleBaseline‐101 | 96.9 | 95.9 | 89.5 | 84.4 | 88.4 | 84.5 | 80.7 | 89.1 | HRNet | 97.1 | 95.9 | 90.3 | 86.4 | 89.1 | 87.1 | 83.3 | 90.3 | Proposed method | 97.8 | 95.4 | 90.1 | 83.9 | 88.5 | 87.2 | 82.8 | 88.9 |
|
Table 3. Comparison of different methods under MPII dataset
Model | #Params /MB | AP /% |
---|
HRNet | 28.5 | 74.4 | Proposed(A) | 9.8 | 73.6 | Proposed(B) | 10.1 | 74.8 |
|
Table 4. Ablation experiment under COCO validation dataset
Model | Training time /h | Single image detection time /ms | Accuracy (PCK) /% |
---|
CPMs | 131 | 106.3 | 85.5 | HRNet | 54 | 52.2 | 90.3 | Proposed model | 45 | 24.0 | 88.9 |
|
Table 5. Speed real-time comparison