Author Affiliations
1School of Investigation, People’s Public Security University of China, Beijing 100038, China2Institute of Forensic Science, Ministry of Public Security, Beijing 100038, China3Shanghai Key Laboratory of Crime Scene Evidence, Shanghai 200083, Chinashow less
Fig. 1. Workflow of imaging spectrometer
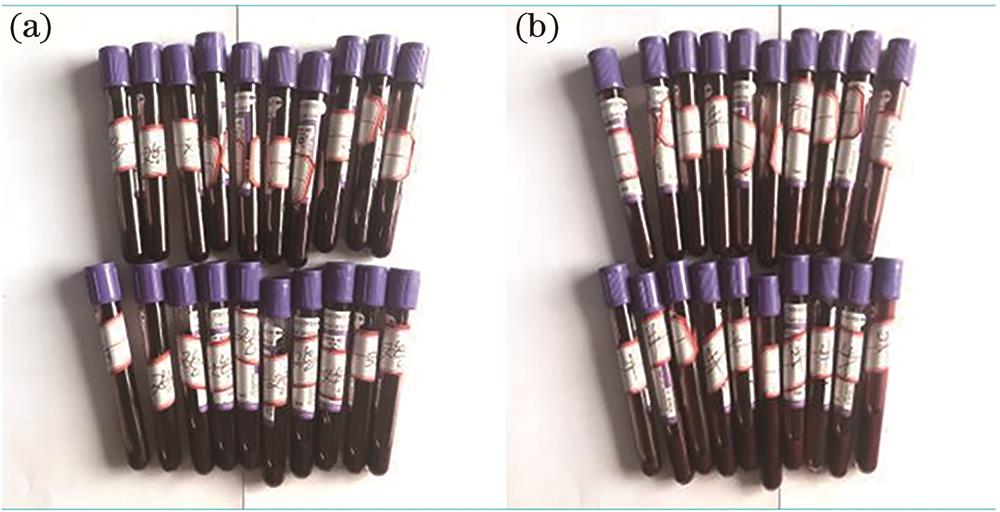
Fig. 2. Chicken blood and bovine blood used in experiment. (a) Chicken blood; (b) bovine blood
Fig. 3. Spectral curves of human blood, chicken blood, and mixed human and chicken blood on five carriers
Fig. 4. Spectral curves of human blood, bovine blood, and mixed human and bovine blood on five carriers
Fig. 5. Differentiation of three comparative samples on 30 vectors
Fig. 6. Differentiation of three comparative samples on 30 vectors
| Number | Carrier | Color | Number | Carrier | Color |
|---|
| 1# | Canvas | Dard Red | 16# | Leather | Black | | 2# | Canvas | White | 17# | Leather | Brown | | 3# | Canvas | Bright Red | 18# | Leather | Green | | 4# | Canvas | Black | 19# | Chamois | Dard Red | | 5# | Canvas | Brown | 20# | Chamois | White | | 6# | Canvas | Green | 21# | Chamois | Bright Red | | 7# | Cotton | Dard Red | 22# | Chamois | Black | | 8# | Cotton | White | 23# | Chamois | Brown | | 9# | Cotton | Bright Red | 24# | Chamois | Green | | 10# | Cotton | Black | 25# | Paperboard | Pink | | 11# | Cotton | Brown | 26# | Paperboard | Bright Red | | 12# | Cotton | Green | 27# | Paperboard | Yellow | | 13# | Leather | Dard Red | 28# | Paperboard | Blue | | 14# | Leather | White | 29# | Invoice | White | | 15# | Leather | Bright Red | 30# | Envelope | Brown |
|
Table 1. Information and serial number of carriers used in experiment
| Degree | Difference of rank mean(a) | Result of assessment |
|---|
| 1 | a≤15 | - | | 2 | 15<a≤30 | + | | 3 | a>30 | ++ |
|
Table 2. Basis of quality assessment
| Number | Carrier | Human blood and chicken blood | Human blood and the mix of human and chicken blood | Chicken blood and the mix of human and chicken blood |
|---|
| 1 | Dark red canvas | 10.84 | 9.16 | 1.44 | | 2 | Brown cotton | 40.60 | 37.36 | 37.50 | | 3 | Bright red chamois | 35.36 | 34.18 | 25.04 | | 4 | Yellow paperboard | 27.90 | 21.24 | 18.76 | | 5 | Invoice | 49.00 | 32.52 | 29.44 |
|
Table 3. Rank mean difference of human blood, chicken blood, and mixed blood of human and chicken on five vectors
| Number | Carrier | Human blood and chicken blood | Human blood and the mix of human and chicken blood | Chicken blood and the mix of human and chicken blood |
|---|
| 1 | Dark red canvas | - | - | - | | 2 | Brown cotton | ++ | ++ | ++ | | 3 | Bright red chamois | ++ | ++ | + | | 4 | Yellow paperboard | + | + | + | | 5 | Invoice | ++ | ++ | + |
|
Table 4. Quality assessment results of human blood, chicken blood, and mixed human and chicken blood on five carriers
| Number | Carrier | Human blood and bovine blood | Human blood and the mix of human and bovine blood | Bovine blood and the mix of human and bovine blood |
|---|
| 1 | Bright red canvas | 43.70 | 30.14 | 24.10 | | 2 | Black cotton | 33.44 | 13.04 | 34.30 | | 3 | Green leather | 39.78 | 25.74 | 22.72 | | 4 | Bright red chamois | 43.50 | 35.28 | 26.26 | | 5 | Envelope | 37.68 | 27.62 | 24.84 |
|
Table 5. Rank mean difference of human blood, bovine blood, and mixed human and bovine blood on five vectors
| Number | Carrier | Human blood and bovine blood | Human blood and the mix of human and bovine blood | Bovine blood and the mix of human and bovine blood |
|---|
| 1 | Bright red canvas | ++ | ++ | + | | 2 | Black cotton | ++ | - | ++ | | 3 | Green leather | ++ | + | + | | 4 | Bright red chamois | ++ | ++ | + | | 5 | Envelope | ++ | + | + |
|
Table 6. Quality evaluation results of human blood, bovine blood, and mixed human and bovine blood on five vectors
| Number | Human blood and chicken blood | Human blood and the mix of human and chicken blood | Chicken blood and the mix of human and chicken blood | Human blood and bovine blood | Human blood and the mix of human and bovine blood | Bovine blood and the mix of human and bovine blood |
|---|
| 1# | - | - | - | ++ | ++ | - | | 2# | ++ | - | + | ++ | + | + | | 3# | + | + | + | ++ | ++ | + | | 4# | + | + | - | ++ | ++ | ++ | | 5# | + | + | - | ++ | + | + | | 6# | + | - | + | ++ | ++ | + | | 7# | ++ | ++ | - | ++ | + | ++ | | 8# | ++ | + | + | ++ | + | + | | 9# | ++ | ++ | + | + | - | - | | 10# | - | - | - | ++ | - | ++ | | 11# | ++ | ++ | ++ | ++ | + | + | | 12# | ++ | + | + | ++ | + | + | | 13# | ++ | ++ | + | ++ | + | ++ | | 14# | ++ | + | + | + | - | + | | 15# | ++ | + | - | ++ | ++ | + | | 16# | + | + | - | ++ | + | + | | 17# | ++ | + | + | ++ | + | ++ | | 18# | ++ | + | + | ++ | + | + | | 19# | ++ | - | + | ++ | ++ | + | | 20# | ++ | + | + | ++ | + | + | | 21# | ++ | ++ | + | ++ | ++ | + | | 22# | ++ | + | ++ | + | - | - | | 23# | ++ | + | ++ | + | - | + | | 24# | ++ | ++ | ++ | + | - | - | | 25# | + | - | + | ++ | + | ++ | | 26# | + | + | - | ++ | + | + | | 27# | + | + | + | ++ | ++ | ++ | | 28# | ++ | + | + | + | + | - | | 29# | ++ | + | ++ | ++ | ++ | ++ | | 30# | ++ | + | + | + | + | + |
|
Table 7. Statistics of quality assessment results of 6 samples on 30 carriers