
Zhuang MIAO, Yong ZHANG, Wei-Hua LI. Real-time infrared target detection based on center points[J]. Journal of Infrared and Millimeter Waves, 2021, 40(6): 858
- Journal of Infrared and Millimeter Waves
- Vol. 40, Issue 6, 858 (2021)
Abstract
Introduction
Target detection is one of the most critical yet challenging tasks in infrared (IR)imaging systems,as it involves a combination of target classification and localization[
From the perspective of detection methods,current CNN-based detection models can be roughly divided into anchor-based detectors and anchor-free detectors. Anchor-based detectors start with setting a huge number of pre-defined rectangle bounding boxes (anchors)with different ratios and scales on high-level feature maps extracted from images. Taking these anchors as proposal candidates,two-stage detectors such as Faster R-CNN[
By avoiding the intricate design and heavy computation of anchors,anchor-free detectors based on key points have drawn much attention recently[
To alleviate the resource consumption of CNNs,a lot of efficient architectures have been designed,including SqueezeNet[
To achieve a better balance between detection accuracy and speed for CPU-only IR systems,we propose a real-time infrared target detection model inspired by both the neatly anchor-free detector CenterNet and the lightweight units introduced by ShuffleNetV2[
1 Proposed method
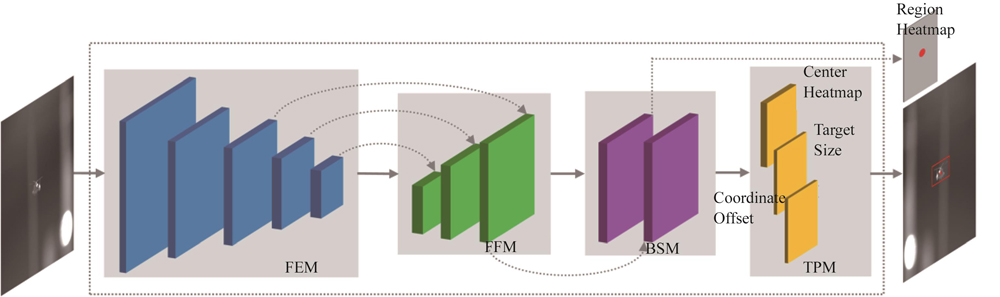
In this section,we present the details of TCPD,including the network design and workflow. Although our model is designed mainly focusing on detection efficiency,its accuracy still reaches a high level.
![]()
Figure 1.The overall architecture of TCPD
1.1 Feature extraction module
Feature extraction module,commonly called the backbone network,is the heaviest part of a detection model in terms of computation. Therefore,designing a lightweight backbone with strong representation power is fundamental to accurate fast detection. Starting from ShuffleNetV2,we build a new lightweight FEM. It only requires 365 million FLOPs when the input resolution is 384×384 pixels. The detailed structure of FEM is listed in
| Stage | Output Size | Output Channels | Layer |
|---|---|---|---|
| Input | 384×384 | 3 | Image |
| Stage1 | 192×192 | 24 | 3×3,Conv,s2 |
| Stage2 | 96×96 | 24 | 3×3,Max Pooling,s2 |
| Stage3 | 48×48 | 116 | Block1×1 Block2×4 |
| Stage4 | 24×24 | 232 | Block1×1 Block2×8 |
| Stage5 | 12×12 | 464 | Block1×1 Block2×4 |
Table 1. Network structure of FEM
As listed,FEM consists of five stages in total. After the process of each stage,the feature resolution is halved while the feature channel increases. In “Stage1” and “Stage2”,FEM first quickly down-samples the input resolution to 1/4 and expands the feature channel to 24 through a simple 3×3 convolution and a 3×3 max pooling. From “Stage3” to “Stage5”,each stage is stacked by several repeated blocks shown in
![]()
Figure 2.The structure of blocks in FEM
1.2 Feature fusion module
Image features extracted by FEM at different stages represent different levels of information. Low-level features in early-stage feature describe more spatial details. By contrast,high-level features in late-stage feature maps capture more contextual information. As a result,localization is more sensitive to larger early-stage feature maps,while classification relies more on smaller late-stage feature maps. To better leverage both spatial and contextual information for detection,a simple feature fusion module is designed.
![]()
Figure 3.The network structure of FFM
Starting from “Stage5”,FFM combines four stages of FEM through a “bottom-to-up” structure. As the dimension of feature maps (size and channel)varies between two adjacent stages,two steps are needed to complete a single feature fusion. The first step is channel compression. It is through “Block3” for the first two times,while through a 3×3 convolution for the last time. As shown in
1.3 Background suppression module
Generally speaking,a high-performance network is expected to focus on features in the foreground region rather than the background counterparts. To achieve this goal,we design a computation-friendly Background Suppression Module (BSM)to guide the network to learn proper feature distribution explicitly.
![]()
Figure 4.The network structure of BSM
BSM has two functions:predicting foreground regions and re-weighting feature maps over spatial dimensions. Foreground prediction is the basis of feature re-weighting. During training,BSM first passes the input from FEM to a single-layer detection head through two convolutional layers. The detection head then predicts foreground regions within one heatmap. Ground-truth foreground regions are defined as the combination of all ground-truth targets mapped to the heatmap. The region of each ground-truth target is produced by a 2D-Gaussian kernel,formulated as:
where
where
As the trained BSM has the ability to predict foreground regions,the intermediate layer before the detection head can guide the feature distribution. For computational efficiency,only an element-wise convolution followed by the sigmoid function is used to re-weight the input feature maps over the spatial dimensions.
1.4 Target prediction module
Target prediction module is the last module of TCPD. It is responsible for predicting all information that is needed to localize and classify targets. To match the light-weight design of other modules,a unified structure including only one 3×3 convolutional layer is used in TPM,as shown in
![]()
Figure 5.The network structure of TPM
TPM treats target detection as its center localization and size regression. For center localization,it predicts center confidence scores of different target categories on corresponding center heatmaps. The ground-truth heatmaps are produced by the same Gaussian kernel defined in
where
where
For size regression,TPM directly predicts the target size on the center point with width and height. The target size is also trained with L1 loss:
where
Combined with the loss
where
Different from training,a simple post-processing method is introduced to generate the final predictions during inference. Instead of using IoU-based NMS,a 3×3 max-pooling layer is used on the center heatmaps to select the top 100 center points with the highest confidence scores. After adjusting by coordinate offsets,all selected center points and their corresponding target sizes are remapped to the original image. The final results are those with confidence scores above a manual threshold.
2 Experiments
In this section,we first evaluate the performance of TCPD on both the self-built infrared aerial target dataset and the public visible dataset PASCAL VOC. An ablation study is then conducted to evaluate our design furthermore.
2.1 Dataset and implementation details
In our experiments,an infrared aerial target dataset is built for training and testing. There are 2 758 images with 3 000 labeled infrared targets in the dataset. All images are captured from ground-to-air infrared videos. The labeled targets consist of five categories:bird,helicopter,airliner,trainer,and fighter. The ratio of the training set and test set is 7:3. Results on the public dataset PASCAL VOC are also reported to verify the generalization ability of TCPD. PASCAL VOC dataset has natural images from 20 categories. The VOC 2007 and 2012 trainval sets are combined for training,while the VOC 2007 test set is used for testing.
We implement TCPD with Pytorch. It is trained on a single GPU 1080ti and tested on CPU 9900ks. During training,the input resolution is set to 384×384. Standard data augmentation is applied,including random flipping,random scaling,cropping,and color jittering. Adam is adopted to optimize the total loss. By default,TCPD is trained with a batch size of 32 for 150 epochs. The learning rate starts from 1.25e-3 and decays by a factor of 0.1 at the 70th epoch,and 120th epoch.
2.2 Target detection
Accuracy is one of the most critical metrics for a detection model. A good light-weight model requires accurate classification and localization while keeping efficiency. We first evaluate our model on the infrared dataset. The results are shown in
| Model | Input Size | mAP/(%) | AP /(%) | |||||
|---|---|---|---|---|---|---|---|---|
| Bird | Fighter | Airliner | Helicopter | Trainer | ||||
| CenterNet | 384×384 | 88.04 | 76.73 | 88.95 | 94.91 | 90.77 | 88.84 | |
| YOLOv3 | 416×416 | 93.02 | 87.70 | 93.97 | 95.97 | 94.84 | 92.66 | |
| Tiny-YOLOv3 | 416×416 | 80.08 | 66.58 | 83.16 | 93.85 | 84.92 | 71.90 | |
| Tiny-YOLOv4 | 512×512 | 82.87 | 85.60 | 91.06 | 95.35 | 89.13 | 53.23 | |
| FKPD | 384×384 | 88.98 | 79.40 | 90.84 | 95.01 | 90.27 | 89.39 | |
| TCPD | 384×384 | 90.24 | 79.44 | 90.69 | 96.02 | 94.68 | 90.35 | |
Table 2. Detection results on infrared dataset
As shown in
![]()
Figure 6.Examples on infrared dataset
In addition to evaluating TCPD on the infrared dataset,the model is also trained on the VOC dataset to verify its generalization ability. The network and all training hyperparameters keep the same as those used on the infrared dataset. The results are reported in
| Model | Input Size | mAP/(%) |
|---|---|---|
| CenterNet | 384×384 | 68.24 |
| YOLOv3 | 416×416 | 76.80 |
| Tiny-YOLOv3 | 416×416 | 58.40 |
| Tiny-YOLOv4 | 416×416 | 65.71 |
| FKPD | 384×384 | 61.61 |
| TCPD | 384×384 | 66.76 |
Table 3. Detection results on VOC dataset
As the VOC dataset contains more types of targets and more complex scenarios,it is reasonable that large GPU-based models with more powerful representation abilities perform better than TCPD. However,TCPD still achieves 66.76% mAP,which is close to CenterNet while two times faster. Compared with Tiny-YOLOv3 and FKPD,TCPD surpasses them by 8.26% and 5.05%,respectively. As for the latest Tiny-YOLOv4,TCPD still outperforms it by 1.05%. The results demonstrate that TCPD can adapt target detection better in different applications. Some examples are shown in
![]()
Figure 7.Examples on the VOC dataset
2.3 Inference speed
As discussed,inference speed plays a significant role in determining whether the model can be applied in most IR systems without GPU acceleration. Computational cost (FLOPs)and model size (Parameters)are two key metrics to evaluate a light-weight model. The computational cost has a direct influence on the inference speed. Lower FLOPs always mean faster detection. While the model size directly affects the storage cost. A model with fewer parameters makes it easier to deploy and has lower FLPOs.
| Model | FLOPs/Bn | Parameters/M | Inference Time/ms |
|---|---|---|---|
| CenterNet | 8.69 | 14.22 | 48.90 |
| YOLOv3 | 27.93 | 61.63 | 134.07 |
| Tiny-YOLOv3 | 2.34 | 8.68 | 31.71 |
| Tiny-YOLOv4 | 2.91 | 5.88 | 26.23 |
| FKPD | 1.55 | 2.03 | 25.86 |
| TCPD | 0.49 | 0.95 | 21.69 |
Table 4. Real-time analysis of TCPD
With only 0.49 billion FLOPs and 0.95 million parameters,TCPD achieves real-time single frame detection on the CPU at a speed of 21.69 ms. It is 10.02 ms and 4.17 ms faster than Tiny-YOLOv3 and FKPD,with merely 21% and 34% FLOPs. The speed of Tiny-YOLOv4 is on par with FKPD,which is 4.54 ms slower than TCPD. Compared with the other two GPU-based models,the speed advantage of TCPD is more significant. Combined with the discussion in subsection 2.2,TCPD achieves a better performance,which keeps the balance of accuracy and speed. As a result,it is more suitable for the application in CPU-only IR systems,which requires accurate target detection at a real-time speed.
2.4 Ablation study
In this subsection,we first evaluate the network design of TCPD. Experiments include varying input resolution,compressing the feature channel,and module ablation. The results are shown in
| Model | Input Size | mAP/(%) | Inference Time/ms |
|---|---|---|---|
| TCPD(baseline) | 384×384 | 90.24 | 21.69 |
| TCPD-small | 320×320 | 89.85 | 18.22 |
| TCPD-large | 512×512 | 92.38 | 32.70 |
| TCPD-compressed | 384×384 | 88.60 | 17.90 |
| TCPD w/o FFM | 384×384 | 89.29 | 20.15 |
| TCPD w/o BSM | 384×384 | 88.75 | 20.43 |
Table 5. Ablation study on the design of model
Input resolution is an important factor that has a notable influence on the performance of TCPD. Smaller images mean low-resolution feature maps,which leads to the loss of detailed features. Larger images can improve detection accuracy while slows down the inference speed. Line 2 and line 3 in
In addition to the network design,we also investigate the influence of the Gaussian kernel defined in
| Dataset (mAP/(%)) | ||
|---|---|---|
| Infrared | VOC | |
| 0.35 | 89.42 | 64.81 |
| 0.55 | 90.56 | 66.00 |
| 0.75 | 90.24 | 66.76 |
| 0.95 | 90.31 | 66.24 |
Table 6. Ablation study of Gaussian kernel
Ranging from 0.35 to 0.95,the variation of
3 Conclusion
We proposed a new real-time infrared target detection model TCPD based on center points. With the benefit of lightweight design,its computational cost is low,and it can keep the fast inference speed on CPU-only devices. In addition to fundamental feature extraction and target prediction,the Feature Fusion Module and Background Suppression Module are designed to improve feature representation. Evaluations on both infrared and VOC dataset demonstrate the outstanding performance of TCPD as it achieves a better balance between accuracy and speed. In summary,it provides a new choice for real-time detection in IR systems. In the future,we plan to investigate methods such as network pruning to speed up the model while keeping detection accuracy and finally deploy it as a key module in real infrared tracking systems.
References
[1] S C Wu, Z R Zuo. Small target detection in infrared images using deep convolutional neural networks. J. Infrared Millim.Waves, 38, 371-380(2019).
[4] S Q Ren, K He, R Girshick et al. Faster r-cnn: Towards real-time object detection with region proposal networks, 91-99(2015).
[5] K He, G Gkioxari, P Dollár et al. Mask r-cnn, 2961-2969(2017).
[8] J Redmon, A Farhadi. YOLO9000: better, faster, stronger, 7263-7271(2017).
[9] J Redmon, A Farhadi. Yolov3: An incremental improvement. https://arxiv.org/abs/1804.02767
[11] H Law, J Deng. Cornernet: Detecting objects as paired keypoints, 116-131(2018).
[13] X Y Zhou, D Q Wang, P Krähenbühl. Objects as points. https://arxiv.org/abs/1904.07850
[19] W Wen, C Wu, Y Wang et al. Learning structured sparsity in deep neural networks, 2074-2082(2016).
[22] I Hubara, M Courbariaux, D Soudry et al. Quantized neural networks: Training neural networks with low precision weights and activations. The Journal of Machine Learning Research, 18, 6869-6898(2017).
[23] T Y Lin, P Goyal, R Girshick et al. Focal loss for dense object detection, 2980-2988(2017).

Set citation alerts for the article
Please enter your email address
© Copyright 2018-2021 | Chinese Laser Press. All Rights Reserved 沪ICP备15018463号-20